
Willingness to pay is the most a customer will pay for a product before deciding it is not worth the money. Every pricing decision you make is a bet on where that threshold sits, and pricing research exists to replace that bet with a measurement.
The concept is simple. Measuring it well is not, because you cannot ask the question directly. "How much would you pay for this?" invites a negotiation, not an answer. The methods that work approach the threshold sideways, through perceptions, purchase intent, and forced trade-offs. This guide covers what willingness to pay actually measures, the honest limits of measuring it with surveys, and the four methods that do it in practice.
What willingness to pay actually measures
Economists call the threshold a reservation price: the price at which a specific buyer, for a specific offer, at a specific moment, is indifferent between buying and walking away. Below it, the value they expect exceeds the price and they buy. Above it, the same person passes.
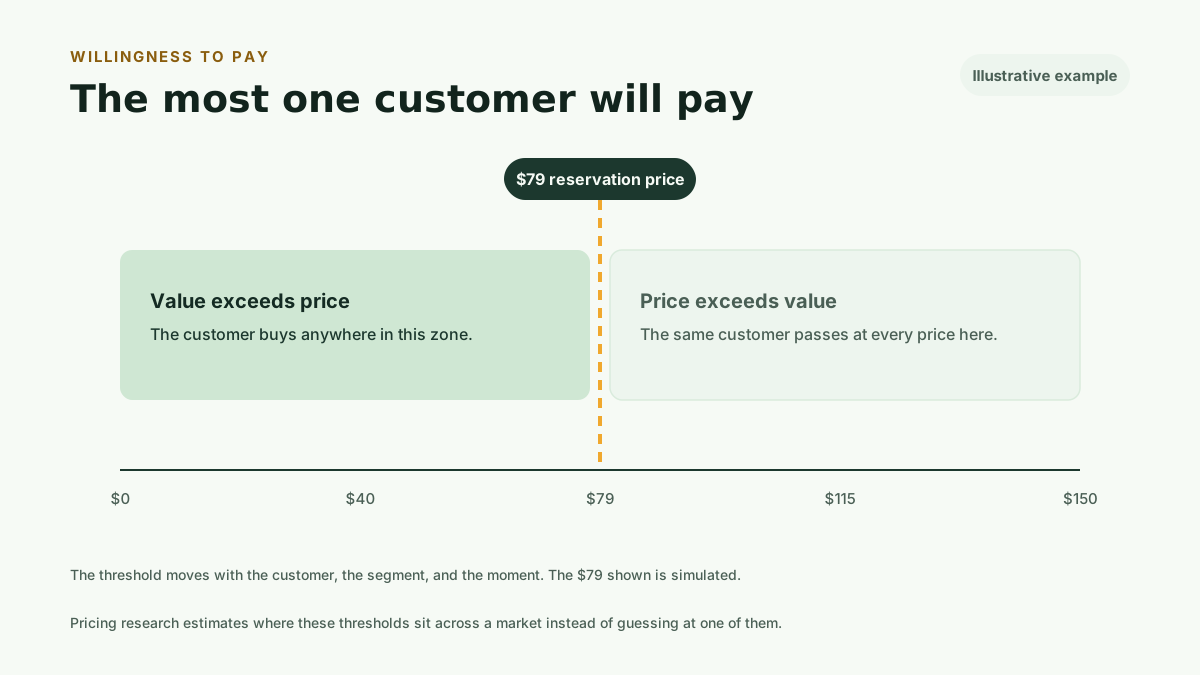
Three properties of that threshold matter for anyone pricing a product.
It varies by person. A two-person startup and a fifty-person team can look at the same plan and hold thresholds that differ by an order of magnitude. That spread is why segments exist, and why a single average hides more than it reveals.
It varies by context. The same buyer will pay more when the purchase is urgent, when budget is expiring, or when the product is framed against an expensive alternative. Willingness to pay is not a fixed attribute of a person. It is a judgment they form about an offer.
It is invisible. Customers do not know their own threshold as a number, and they cannot recite it on request. What they can do reliably is react to specific prices and make choices between specific offers. Every method below is built on that fact.
Stated and revealed willingness to pay
There are two kinds of evidence about willingness to pay, and the difference between them should shape how you read every survey result you ever see.
Stated willingness to pay is what people tell you in research: survey answers, interview estimates, reactions to hypothetical prices. It is cheap to collect and it is the only option for an offer that does not exist yet.
Revealed willingness to pay is what people demonstrate with money: conversions at a real price, upgrades, churn after an increase. It is the ground truth, and you can only collect it after you have already committed to a price.
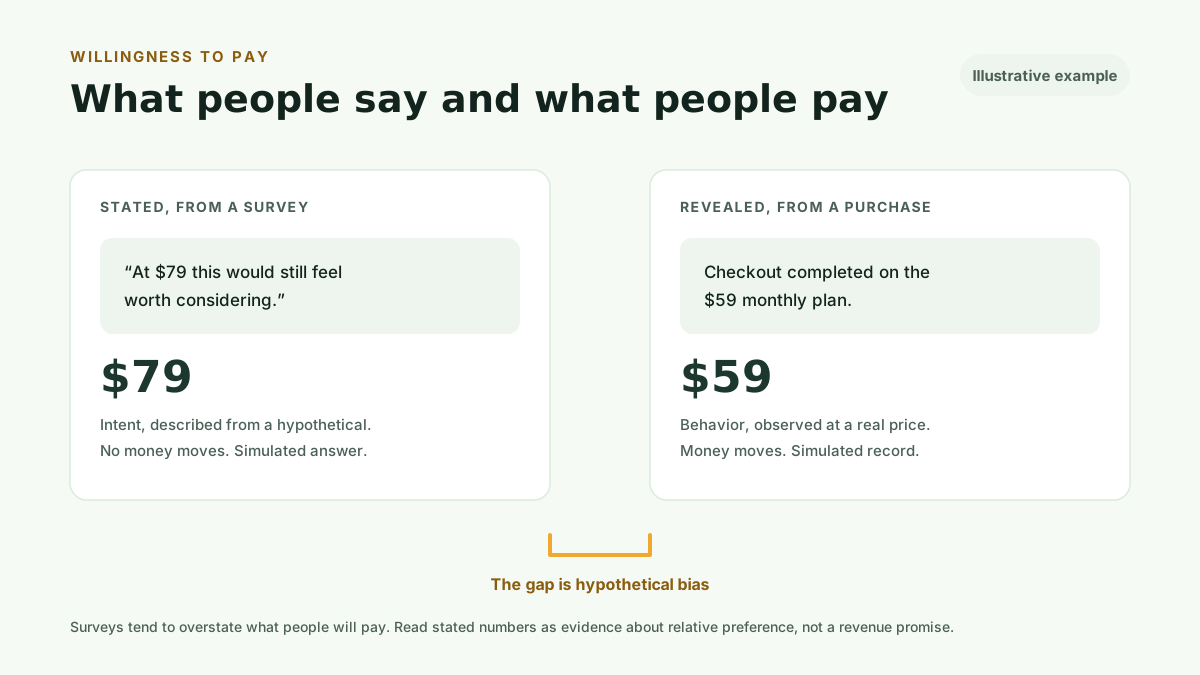
The gap between the two has a name: hypothetical bias. When nothing is at stake, people tend to overstate what they would pay. The research literature has documented this for decades, and no question wording eliminates it entirely.
This is not a reason to skip surveys. It is a reason to read them correctly. Stated results are strongest as relative evidence: which package earns more preference, where perceptions of "too expensive" begin, how demand falls as price rises. Treat the shape of the curve as signal and any single dollar figure as an estimate with error around it, then confirm the final number with real transactions. The approach in how to test SaaS pricing with real customers is built around exactly that sequence.
Four ways to measure willingness to pay
Four survey methods dominate practical willingness-to-pay research. Each asks a different kind of question, and each fits a different decision.
Van Westendorp asks four price-perception questions: at what price the product becomes too cheap to trust, a bargain, expensive, and too expensive to consider. The intersections of the answer curves define an acceptable price range. It is the standard starting point when nothing is priced yet, because it needs no candidate prices as input.
Gabor-Granger shows each respondent specific prices and asks whether they would buy at each one. The result is a demand curve across your candidate prices and a modeled revenue curve on top of it. Use it when the question is a choice between concrete price points.
CBC Conjoint shows repeated choices between realistic packages that vary in features, limits, and price. Because respondents trade money against features the same way a pricing page forces them to, it estimates how much each part of an offer is worth. It is the tool for designing and pricing tiers.
MaxDiff asks which item in a small set matters most and which matters least, across repeated sets. It does not output a price. It ranks what customers value, which tells you what the value in willingness to pay consists of, and which features can carry a paid tier.
Choosing the right method for your question
The fastest way to pick a method is to write down the decision you need to make and route from there.
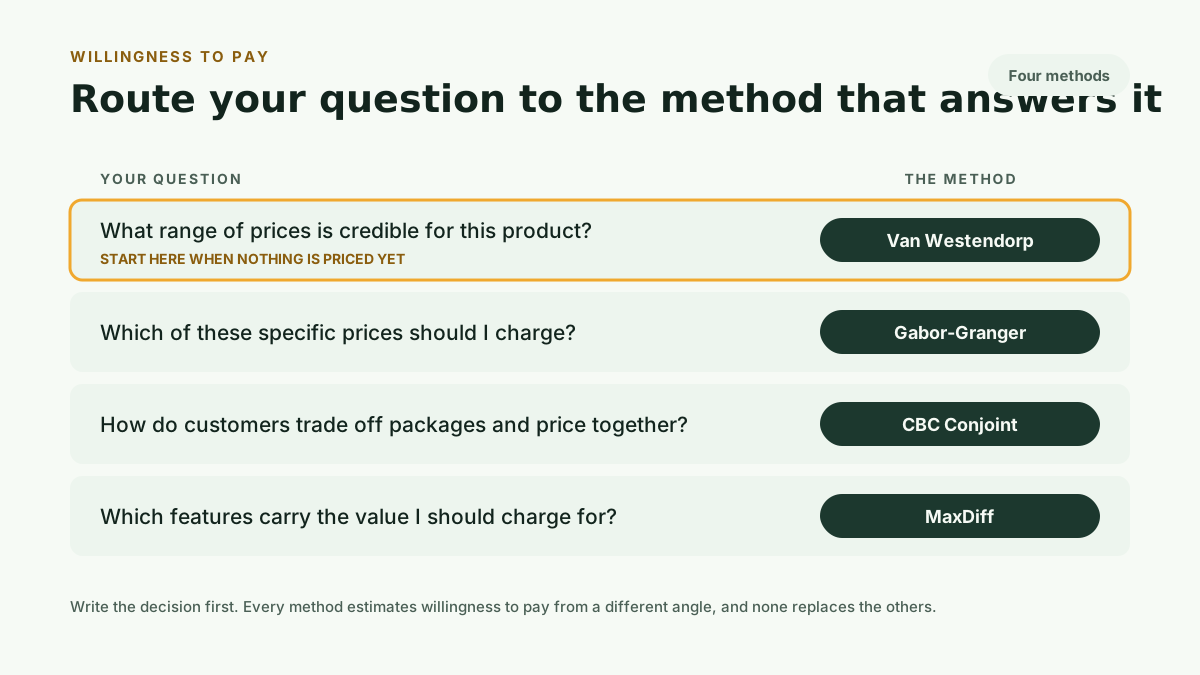
If you need a credible range for something unpriced, start with Van Westendorp. If you are choosing among specific prices, run Gabor-Granger. If you are designing packages, run CBC Conjoint. If you need to know which features carry the value, run MaxDiff first and price the winners with one of the others.
The methods also combine. A common sequence is Van Westendorp to establish the range, then Gabor-Granger to compare two or three points inside it. For a deeper treatment of the routing decision, see how to do pricing research without hiring a consultant.
What willingness to pay research cannot tell you
A willingness-to-pay study reduces uncertainty. It does not remove it, and it is worth being precise about the residue.
It does not predict conversion. A respondent whose stated threshold sits above your price can still fail to buy, because purchases depend on timing, budget approval, and alternatives that a survey does not capture.
It does not prove causation. If customers who value one feature also state higher thresholds, the feature did not necessarily cause the higher number. Segments differ in many correlated ways.
It is sample-dependent. A study of your existing customers measures people who already chose you at your current price. Prospects who bounced off your pricing page hold systematically different thresholds, and no reweighting of an existing-customer sample fully recovers them.
It is a point-in-time reading. Thresholds move when competitors reprice, when budgets tighten, and when your product improves. A study from eighteen months ago describes a market that no longer exists.
None of this argues against measuring. It argues for measuring cheaply and often, with your own users, and for treating the result as evidence that feeds a decision rather than a number that makes it for you.
Run this method with your users
Kinetic Pro includes unlimited customer-recruited Van Westendorp, Gabor-Granger, MaxDiff, and CBC Conjoint studies, plus Kinetic Workspace, for $99 per month or $990 per year. The monthly plan starts with a 30-day free trial: card required, cancel anytime.
For a single decision, individual studies start at $149:
- Advanced Van Westendorp: $149
- Gabor-Granger: $199
- MaxDiff: $279
- CBC Conjoint: $499
Every study runs with your own customers or prospects, so the willingness to pay you measure belongs to the market you actually sell to.
Start 30-day free trial to run every method with your users, or Buy one study when one decision needs evidence now.