
Van Westendorp pricing research helps you find the range of prices customers consider credible for a defined product.
The method asks each respondent for four price thresholds. The analysis turns those answers into four cumulative curves. Their intersections describe the lower and upper limits of an acceptable range and two reference points inside it.
Peter van Westendorp introduced the Price Sensitivity Meter at the 1976 ESOMAR Congress. The method remains useful because it asks customers to describe different price perceptions instead of naming one preferred price.
Van Westendorp Price Sensitivity Meter (PSM)
The Price Sensitivity Meter, or PSM, is the formal name for the Van Westendorp method. The two terms describe the same technique: the same four price-perception questions about one defined product, analyzed as the same cumulative curves. Peter van Westendorp presented the method as the Price Sensitivity Meter in his original 1976 ESOMAR paper, and published research has carried that name since. Software documentation and survey platforms split between the two names, so a search for either term reaches the same method under a different label.
Nothing separates a PSM study from a Van Westendorp study. Everything in this guide, from the four questions to the intersection analysis, describes the Price Sensitivity Meter.
The four Van Westendorp questions
Each respondent answers four questions about the same product and billing context:
- At what price would the product feel so cheap that you would question its quality?
- At what price would the product feel like a bargain?
- At what price would the product begin to feel expensive, while remaining worth consideration?
- At what price would the product feel too expensive to consider?
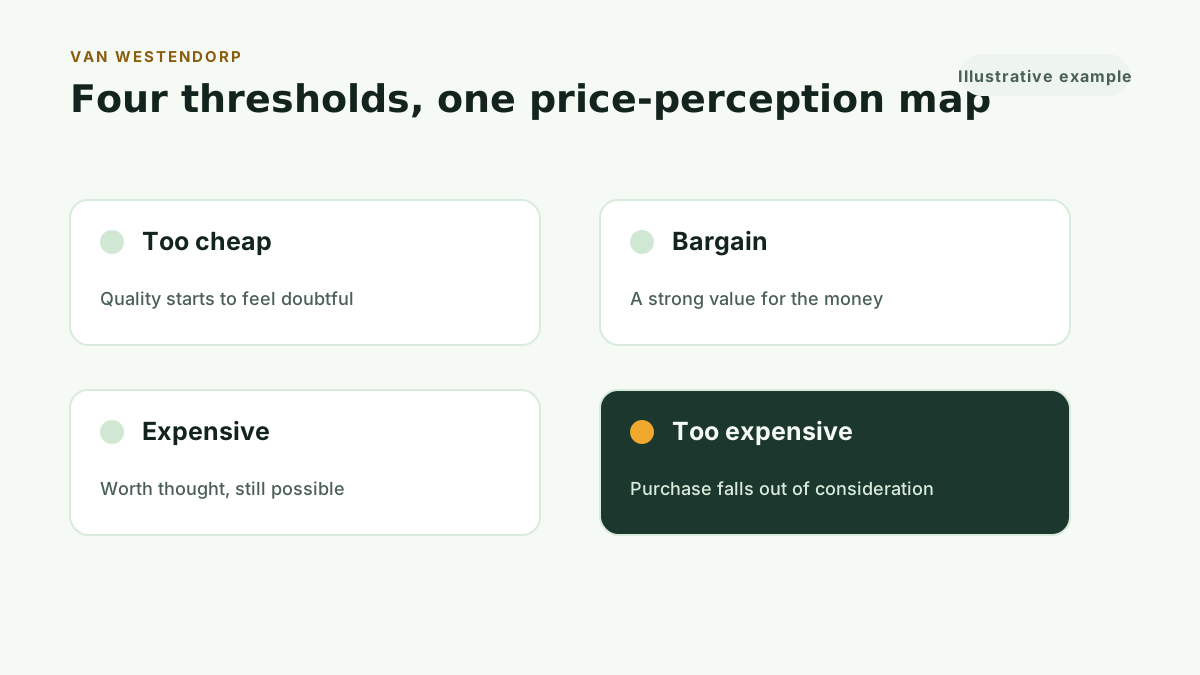
The questions work as a set. “Too cheap” captures the point where a low price can weaken confidence. “Bargain” identifies strong value. “Expensive” marks a price that requires thought. “Too expensive” marks the point where the offer leaves consideration.
Qualtrics lists the same four concepts in its explanation of the method. Conjointly describes the questions as price-perception thresholds for one product or service.
Give respondents a product they can judge
The method needs a stable offer. Describe:
- The product and core use case
- The intended customer
- The billing period and currency
- Included users, usage, or limits
- Support or service that changes the offer
Keep the concept consistent for every respondent. A mixed product description produces mixed price frames.
SaaS founders should state the pricing unit with care. “Per user per month,” “per workspace per month,” and “per company per year” describe different decisions. A respondent should know which one they are judging before entering a price.
Recruit customers with category context
Van Westendorp measures perception among the people you ask. It does not repair a weak sample.
Current customers can judge a repricing decision because they know the product. Qualified prospects can judge a new offer when they understand the problem and match the buyer. Trial users can contribute when they experienced enough of the product to understand its value.
Avoid recruiting a broad audience for convenience. A respondent who cannot imagine buying the product may answer from personal frugality or abstract preference.
Validate the four-answer order
A coherent response follows this order:
Too cheap < bargain < expensive < too expensive
The sequence matters. A “too cheap” value above the respondent’s “expensive” value signals a problem.
Use the survey to prevent avoidable errors:
- Show one currency.
- State the billing period.
- Use numeric validation.
- Repeat the product context near the questions.
- Flag an incoherent order rather than rewriting the answers.
Kinetic refuses to guess what a respondent meant. That preserves the distinction between collected evidence and owner interpretation.
Build the four cumulative curves
The analysis aggregates each threshold across respondents and converts the distributions into four curves:
- Too cheap
- Bargain
- Expensive
- Too expensive
Two curves fall as price rises. Two curves rise. Their intersections create the named Van Westendorp points.
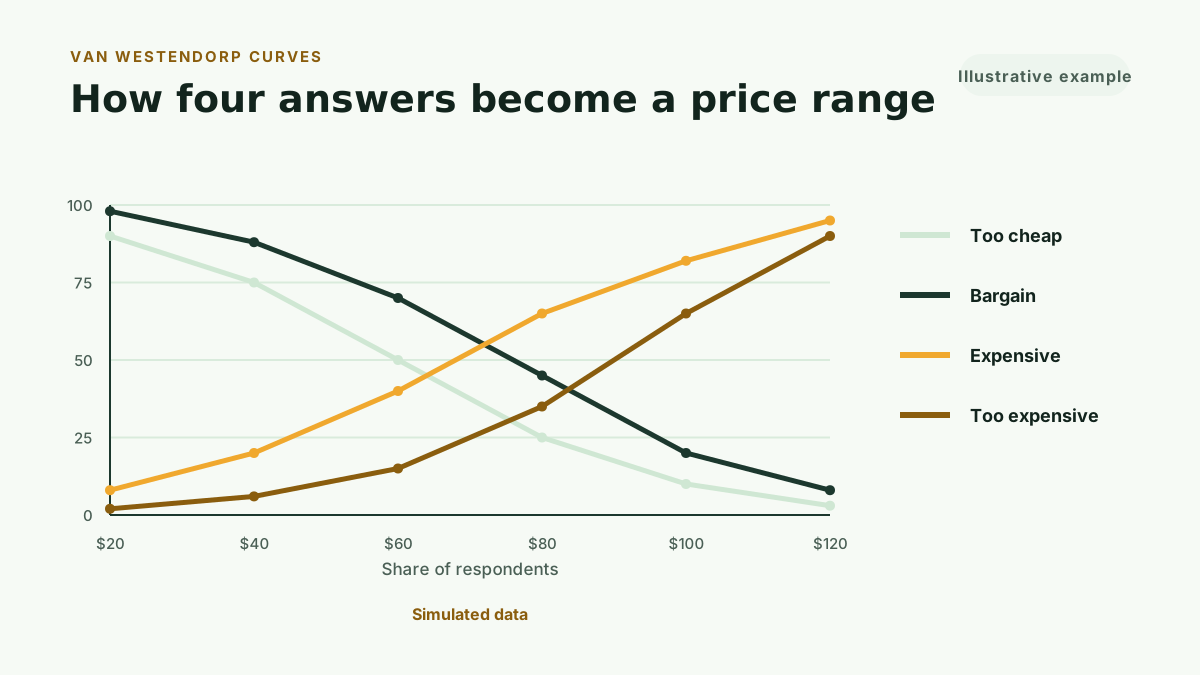
The shape matters more than one isolated number. A narrow acceptable range suggests closer agreement about price boundaries. A wide range can reflect mixed expectations, a broad audience, or a product concept that leaves room for interpretation.
Review the audience and the product description before assigning meaning to the width.
Read the four intersections
Point of marginal cheapness
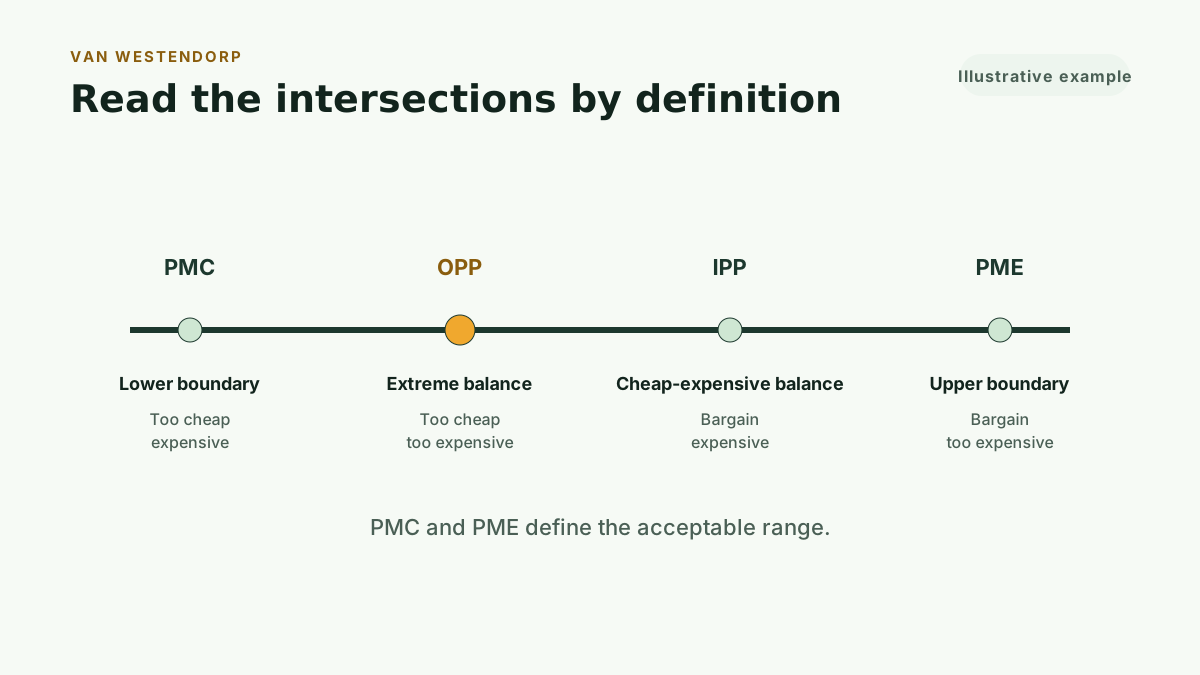
The point of marginal cheapness, or PMC, sits where the too-cheap and expensive curves cross. It forms the lower boundary of the acceptable range.
Below this boundary, concerns about low price and weak quality begin to outweigh the share who see the product as expensive.
Point of marginal expensiveness
The point of marginal expensiveness, or PME, sits where the bargain and too-expensive curves cross. It forms the upper boundary of the acceptable range.
Above this boundary, too-expensive responses begin to outweigh bargain perceptions.
Optimal price point
The optimal price point, or OPP, sits where the too-cheap and too-expensive curves cross. Equal shares of respondents place the price beyond one of the two extreme boundaries.
The name requires care. OPP does not optimize revenue, profit, retention, or lifetime value. It balances extreme price perceptions inside this method.
Indifference price point
The indifference price point, or IPP, sits where the bargain and expensive curves cross. Equal shares describe the price as a bargain and as expensive.
IPP can provide a central market reference. It does not tell you how many customers will purchase at that price.
Use the range for the next decision
PMC and PME define the acceptable range. Use that range to:
- Review whether the current price sits below, inside, or above customer expectations
- Select proposed prices for Gabor-Granger
- Compare customer perception with your positioning
- Identify a segment that may need a different offer
- Frame a controlled launch or repricing test
Suppose the acceptable range runs from $49 to $99. A founder might test $59, $79, and $99 with Gabor-Granger. The second study asks about purchase intent at the proposed prices and produces a modeled revenue comparison.
That sequence gives each method one job. Van Westendorp finds the field. Gabor-Granger compares points inside it. See how to test SaaS price points with Gabor-Granger for that second study, and how to find the right price range for a SaaS product for the full range-first workflow.
Know what Van Westendorp cannot answer
Van Westendorp does not measure observed purchases. Respondents report price perceptions inside a survey.
The method also does not account for your gross margin, sales cost, support load, churn, or expansion. Add those business inputs after the research.
The standard method studies one defined offer. It cannot choose between complex packages where several features and prices change together. CBC Conjoint fits that decision.
Van Westendorp also cannot rank a long list of features. MaxDiff fits that question. Our overview of how to test SaaS pricing with real customers compares all four methods and when each one fits.
Review sample size and response quality
One unusual response has more influence in a small study. A larger matched sample reduces that influence and gives you a better view of the audience distribution.
Kinetic labels fewer than 15 valid responses as directional, adds a caution treatment from 15 to 29, and shows its full-confidence presentation at 30 or more. These thresholds describe the Kinetic interface. Research teams with formal inference requirements should calculate sample needs for their audience and decision.
Review the response set for:
- Incoherent price order
- Duplicate or low-effort responses
- Mixed currencies or billing periods
- Participants outside the target audience
- Product-description confusion
Sample quality starts with recruiting and survey design.
Run this method with your users
Kinetic Pro includes unlimited customer-recruited studies across Van Westendorp, Gabor-Granger, MaxDiff, and CBC Conjoint for $99 per month or $990 per year. The monthly plan starts with a 30-day free trial: card required, cancel anytime.
For a single decision, Kinetic Pricing’s Advanced Van Westendorp study costs $149. You describe the product and customer, share the survey link with your own audience, and receive:
- The four cumulative curves
- PMC, PME, OPP, and IPP
- The acceptable price range
- Sample-confidence guidance
- Exportable response data
- A decision-focused narrative grounded in the calculated results
Start 30-day free trial to run this method with your users, or Buy one study when you need a credible range for the next pricing decision.