
Gabor-Granger pricing research helps you compare a defined set of prices.
The study shows a respondent one price and asks whether they would buy the described product. A yes answer moves the respondent toward a higher price. A no answer moves them toward a lower price. The sequence narrows the point where purchase intent changes.
Across the sample, those answers create a demand curve and a modeled revenue curve for the tested prices.
Use Gabor-Granger when you need to choose among proposed prices. Use a price-range method first when you do not know which prices belong in the test.
Start with a stable offer
The respondent should judge one product with one billing structure.
Describe:
- The customer and use case
- The product outcome
- Included features, usage, or seats
- Billing period and currency
- Contract or commitment
- Support that affects value
Keep the offer fixed while the price changes. If the package changes beside the price, you will not know which difference drove the answer. CBC Conjoint fits a package trade-off study.
Choose prices that support a decision
Your test range needs a credible minimum, maximum, and set of intervals.
Start with prices that your company might use. Include the current price when a repricing decision requires a direct reference. Use the output of a Van Westendorp study when you need customer evidence for the proposed range. How to find the right price range for a SaaS product shows how to turn that range into proposed prices.
Suppose you plan to choose among $59, $79, and $99. Include those points in the study. You may add prices around them to give the demand curve more shape, as long as each price still represents a plausible offer.
Avoid an extreme range built to create an obvious winner. A $5 to $500 test for a product under consideration at $79 spends respondent attention on prices you will not use.
Ask one purchase question at a time
The respondent sees a price and answers a purchase-intent question. The survey changes the next price based on that answer.
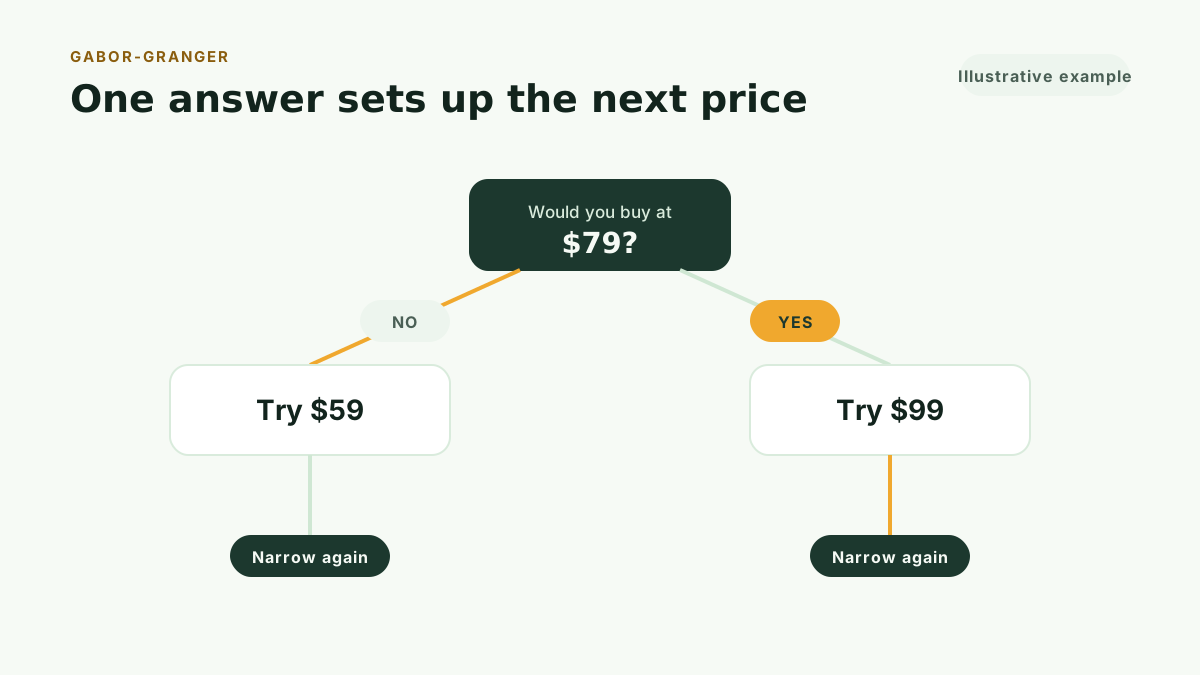
An adaptive sequence reduces the number of irrelevant questions. A respondent who rejects $79 does not need to review every price above it. A respondent who accepts $79 can move toward the higher end.
Qualtrics explains that a yes answer moves the shown price upward and a no answer moves it downward until the intervals finish.
Use purchase language that matches the buying context. “Would you buy?” may work for a self-serve product. A sales-led SaaS offer may need language about choosing, recommending, or moving forward with the plan.
Keep the response scale consistent across the exercise.
Build the demand curve
For each tested price, calculate the share of respondents who said they would buy.
Plot price on the horizontal axis and purchase-intent share on the vertical axis. The curve should fall as price rises. A higher price should not produce a higher cumulative willingness-to-buy share under a coherent implementation.
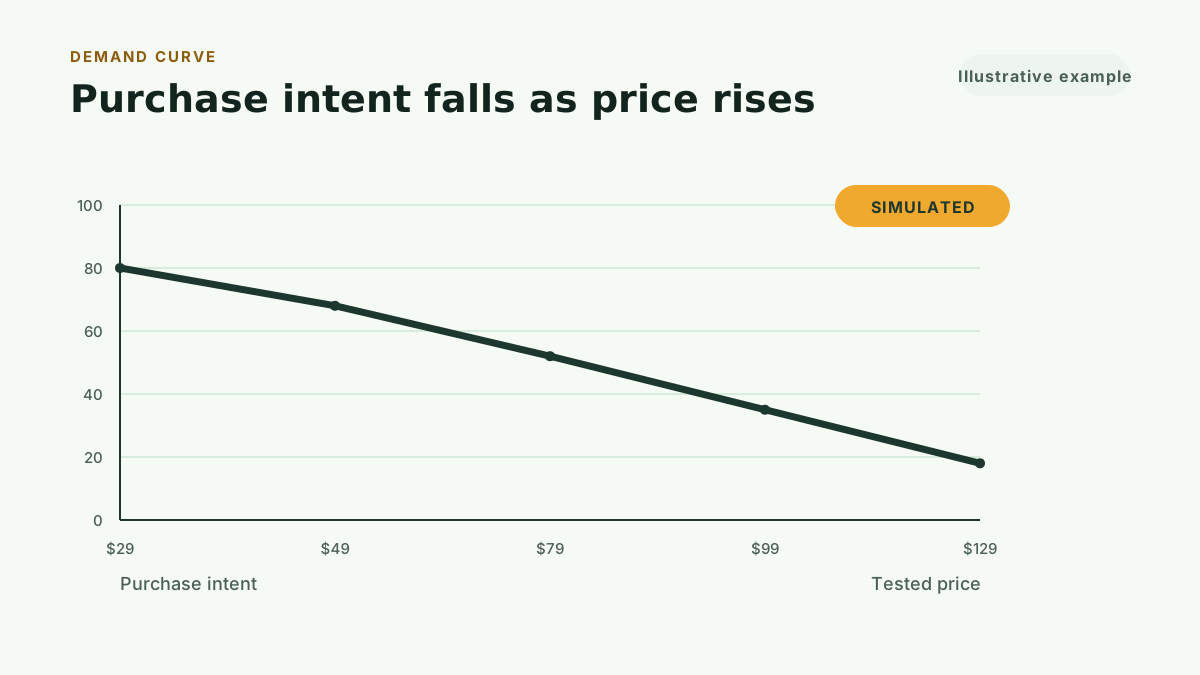
Read the curve for:
- Prices where demand changes little
- Prices where demand drops sharply
- Proposed prices with similar demand
- The gap between the current price and the tested alternatives
A flat section can indicate room to raise price without a large modeled demand change. A steep section can signal a sensitive threshold. Survey purchase intent still differs from observed conversion, so treat the shape as research evidence rather than a forecast.
Calculate modeled revenue
Multiply each tested price by its purchase-intent share.
For a normalized audience of 100 respondents:
Modeled revenue index = price × purchase-intent share
The result lets you compare prices on one common basis. It does not predict total company revenue because the study does not know your traffic, sales capacity, retention, expansion, or acquisition mix.
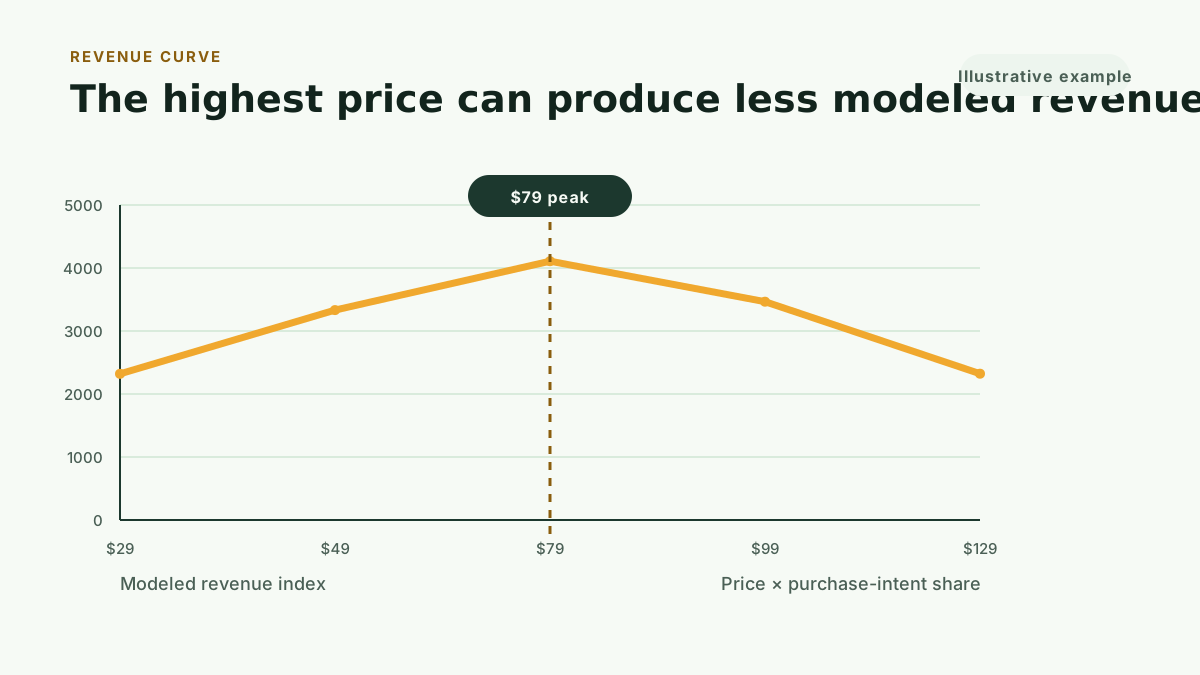
In the example, purchase intent falls as the price rises. Modeled revenue grows through $79, then falls because the higher prices lose too much demand.
The highest tested price does not win. The lowest price does not win. The strongest modeled result comes from the relationship between price and demand.
Read the winning price with context
The revenue peak gives you a proposed price, not an order.
Review:
- Gross margin at the price
- Sales and onboarding cost
- Churn risk
- Expansion path
- Competitive position
- Support burden
- Brand and market signal
A price with a lower modeled revenue index may fit the business better when it improves acquisition, packaging, or expansion. A higher proposed price may fit when the company can accept lower volume in exchange for stronger unit economics.
Write down the trade-off. A pricing decision should state which evidence mattered and which risk the company accepted.
Use Van Westendorp and Gabor-Granger for different jobs
Van Westendorp studies price perception. It helps find the acceptable field.
Gabor-Granger studies stated purchase intent at defined prices. It helps compare points inside that field.
A common sequence:
- Run Van Westendorp to find the lower and upper boundaries.
- Select prices inside or near the acceptable range.
- Run Gabor-Granger to compare demand and modeled revenue.
- Choose the launch price with business context.
- Monitor observed conversion, plan mix, churn, and expansion.
You can skip the first step when you already have a credible proposed range from current pricing, customer interviews, sales data, or a prior study. For the full process from method choice to final decision, see how to test SaaS pricing with real customers.
Recruit respondents who can make the choice
Current customers can evaluate a price change when they understand the product and its outcome. Qualified prospects can evaluate a new offer when they match the buyer and know the category.
Screen for:
- Problem relevance
- Buying role
- Customer fit
- Product or category familiarity
Avoid combining customer groups with different buying contexts unless you plan to analyze them as distinct audiences. A solo founder and a 200-person SaaS company may value the same product through different budgets and workflows.
Avoid four Gabor-Granger mistakes
Testing prices you would never charge
Every price should help a real decision. Use a range tied to your offer and market.
Changing features with the price
Hold the package stable. Use conjoint when you need customers to trade features against price.
Calling purchase intent a sales forecast
The study measures stated intent, an estimate of willingness to pay rather than a purchase record. Track observed behavior after the pricing change.
Extending the curve beyond the test
The results support the tested range. They do not establish demand at untested prices.
Run this method with your users
Kinetic Pro includes unlimited customer-recruited studies across all four methods, three seats, and Kinetic Workspace for $99 per month or $990 per year. The monthly plan starts with a 30-day free trial: card required, cancel anytime.
For a single decision, Kinetic Pricing’s Gabor-Granger study costs $199. You define the product, customer, and tested prices, then share the generated survey with your own audience.
The results include:
- The adaptive price walk
- Purchase intent at each tested price
- A demand curve
- A modeled revenue curve
- The revenue-maximizing tested price
- Sample guidance and exportable data
- A decision-focused narrative grounded in the calculations
Start 30-day free trial to run this method with your users, or Buy one study when you have proposed prices and need customer evidence to compare them.