
Pricing analysis is the work of turning evidence about prices into a pricing decision. The phrase covers three genuinely different activities: analyzing your own revenue data, benchmarking competitor prices, and researching what customers would pay. Teams talk past each other about pricing analysis because each person means a different one of the three.
All three are legitimate. They answer different questions, they fail in different ways, and a sound pricing decision usually draws on more than one. This guide separates them, shows what your own data can and cannot answer, and works through how analysis becomes a decision rather than a report.
What people mean by pricing analysis
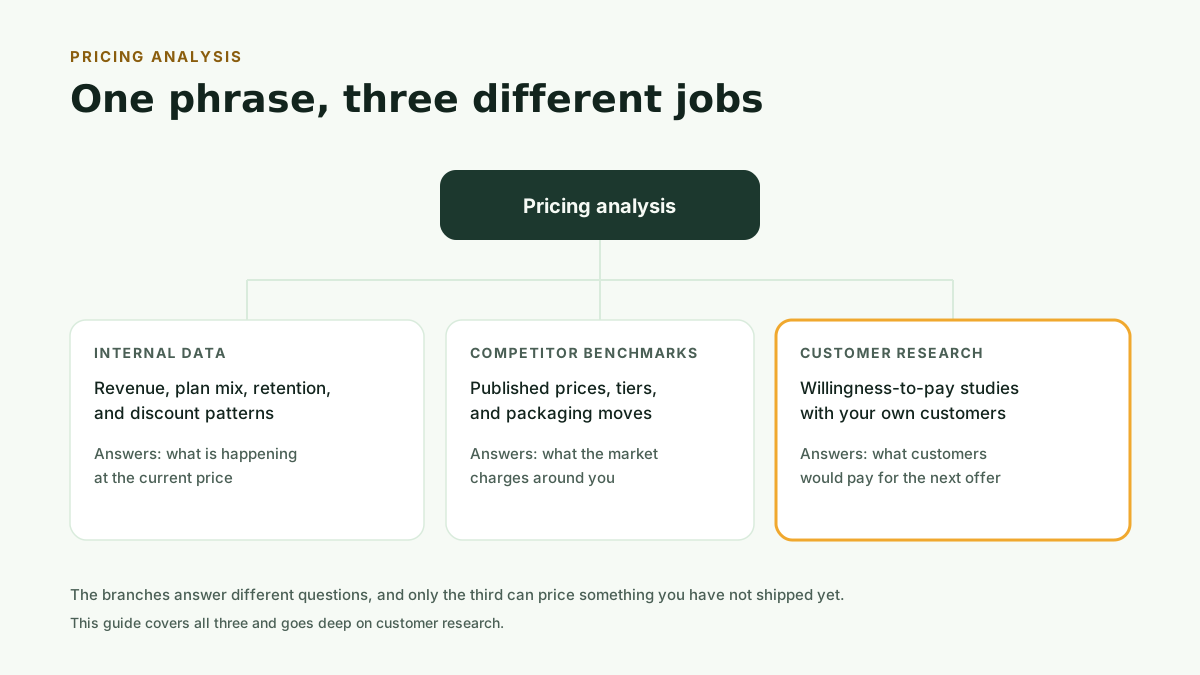
Internal data analysis reads the records your billing system already holds: revenue by plan, plan mix, upgrade and downgrade flows, discounting, churn. It answers what is happening at your current prices.
Competitor benchmarking catalogs the published prices, tiers, and packaging moves around you. It answers what the market charges, which frames what buyers expect before they ever see your pricing page. Kinetic Pricing does not do this branch, and no customer survey substitutes for reading competitors' pricing pages yourself.
Customer research measures willingness to pay directly, by surveying the people who buy. It answers the question the other two cannot: what customers would pay for something they have not been offered yet.
The branches are complements, not rivals. Internal data tells you where you stand, benchmarks tell you the field, and customer research tells you what a change would do before you make it.
Analyzing your own pricing data first
Start with internal data, because it is free, it is observed behavior rather than stated intent, and it sharpens the question any later research should answer.
Four reads deliver most of the value.
Plan mix and revenue concentration. Which tiers hold the customers and which hold the revenue? A bottom tier with most of the customers and little of the revenue is a packaging question waiting to be asked.
Upgrade and downgrade flows. Where do customers move between plans, and what triggers the move? Frequent early upgrades suggest an entry tier that undersells the product. Downgrades clustered at renewal suggest a top tier that overpromises.
Discount patterns. If sales regularly closes at a discount, your effective price already differs from your list price, and the gap is a measurement of doubt about the list.
Retention by price paid. Customers who pay more and stay longer are evidence of headroom in that segment. Customers who churn soon after paying full price are evidence against it.
What internal data cannot do is price anything new. Every record was generated at prices you already charge, by customers who already accepted them. Your data is silent about the plan you have not launched, the price you have not tested, and the prospects who never converted. Treating current-customer behavior as the whole market is the most common analytical mistake in pricing.
Where customer research fits
Customer research closes the gap internal data leaves: it measures reactions to offers that do not exist yet.
That is the difference in kind. Internal analysis is retrospective, a careful reading of choices already made. Research is prospective. It puts a hypothetical price, package, or feature set in front of real buyers and measures the response before anything ships. Methods like Van Westendorp and Gabor-Granger return ranges and demand curves for exactly this purpose, and the full toolkit is covered in how to test SaaS pricing with real customers.
Research results are stated preference, not observed purchases, so they carry error that internal data does not. The two sources discipline each other. If a survey says customers would accept a higher price but your retention data shows churn spiking after every past increase, believe the tension and investigate it. Evidence that agrees from both directions is the strongest signal pricing work produces.
Turning analysis into a decision
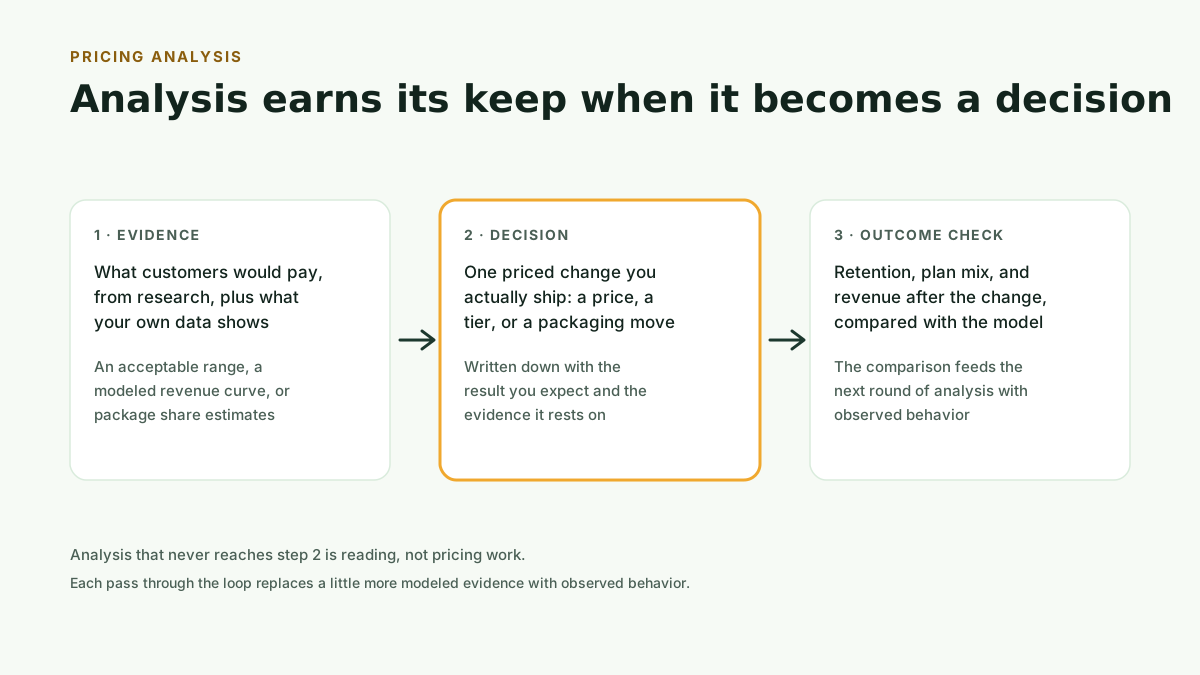
Analysis becomes valuable at the moment it commits you to something. The bridge is usually a small model: what happens to revenue if this change ships and customers respond within some believable range?
Here is the shape of that model on the most common decision, a price increase. The numbers are simulated.
Suppose 200 customers pay $59 per month, for $11,800 in MRR. You are weighing a move to $79. The new price matches current revenue if 149 customers stay, because 149 times $79 is roughly $11,800. That is 75 percent of the base, so the increase survives up to about 25 percent churn among affected customers before it loses money.
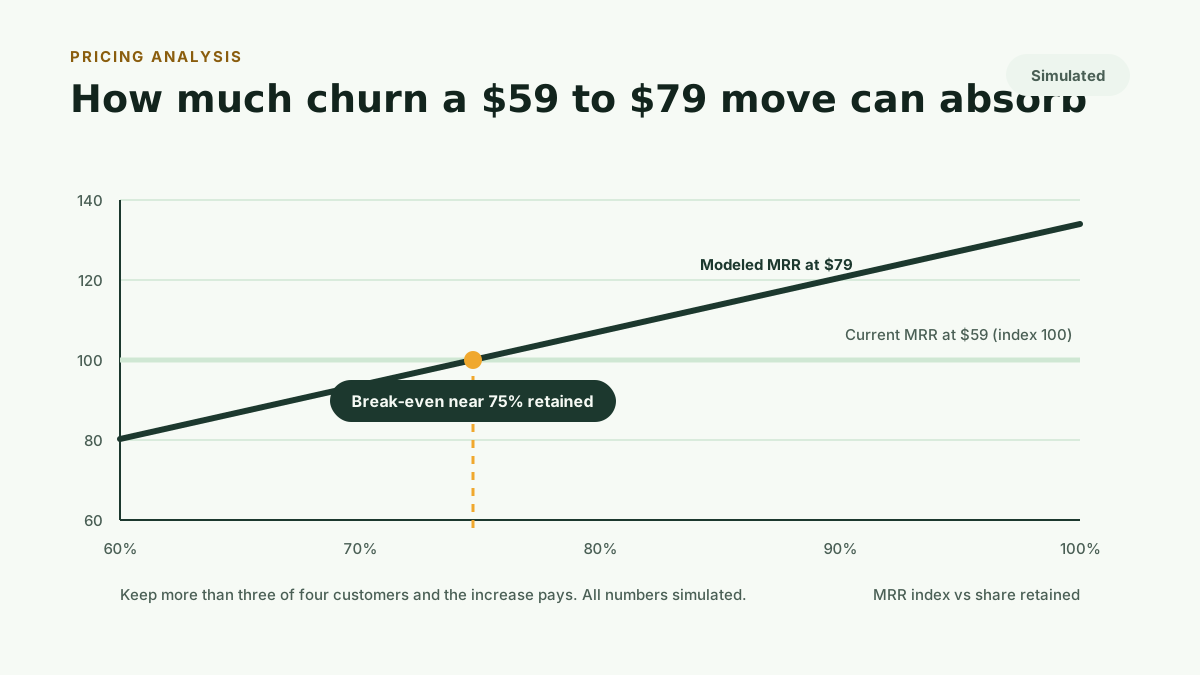
The model does not make the decision. It converts the decision into a question evidence can answer: is churn of 25 percent plausible for this increase in this segment? Your retention history after past changes bears on it, benchmarks bear on it, and a willingness-to-pay study of the affected segment bears on it directly. When the evidence says realistic churn sits well below break-even, the increase is defensible. When it sits near or above, you have learned that cheaply.
Then close the loop. Write down the outcome you expect, ship the change, and compare retention, plan mix, and revenue against the model after a full billing cycle. The comparison is the only step that converts modeled evidence into observed evidence, and it makes the next analysis better than this one.
Common pricing analysis mistakes
Reading correlation as causation. Customers on the annual plan churn less, but the plan did not necessarily cause the loyalty. Committed customers select annual billing. Analysis that skips this step recommends forcing everyone annual and is then surprised.
Analyzing only current customers. Your base is the survivorship set, the people your current prices did not repel. The prospects who bounced hold different thresholds, and decisions about acquisition pricing need evidence about them, not about survivors.
Ignoring segment differences. One acceptable range for the whole market is usually a blend of segments that want different things. A price that averages two segments can fit neither.
Treating modeled revenue as observed. A revenue curve from survey data is a forecast with error bars, not a booking. Ship the change to a small cohort first when the downside is real, and let observed behavior confirm the model before it rolls out everywhere.
Analysis without a decision attached. If no priced change is on the table, analysis produces a document, not an outcome. Name the decision first and the analysis scopes itself.
Run this method with your users
Kinetic Pricing handles the customer-research branch of pricing analysis: willingness-to-pay studies that run with your own customers and prospects, so the evidence describes the market you actually sell to.
Kinetic Pro includes unlimited customer-recruited Van Westendorp, Gabor-Granger, MaxDiff, and CBC Conjoint studies, plus Kinetic Workspace, for $99 per month or $990 per year. The monthly plan starts with a 30-day free trial: card required, cancel anytime. Single studies start at $149.
Start 30-day free trial to put customer evidence behind your next pricing decision, or Buy one study when one change needs a number checked before it ships.