
Use Van Westendorp first when your acceptable price range is unknown, add Gabor-Granger when you have candidate prices, and validate the resulting stated-intent signal with observed behavior before changing price. The choice depends on the decision you need to make, not on which method sounds most sophisticated.
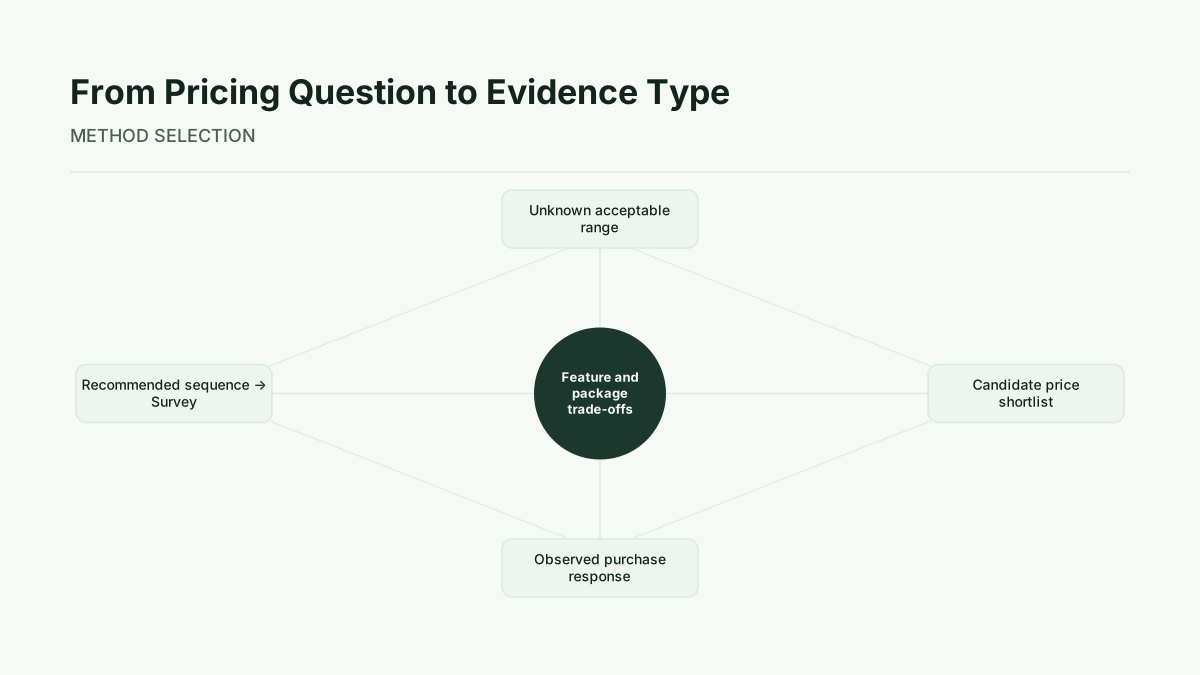
A SaaS team usually needs to answer one of four questions: What price range feels acceptable? Which candidate price produces the strongest stated purchase response? How do buyers trade price against features or packages? What happens when a live buyer encounters the price? These questions produce different evidence. Survey methods measure stated perceptions, stated intent, or stated choice. Experiments and sales data measure revealed behavior. That distinction should remain visible throughout the analysis.
What Price Sensitivity Analysis Can and Cannot Measure
Price sensitivity is not one universal buyer attribute. It varies with category, market, and purchase context, as described in BCG's research across 40,000 consumers globally. The same person may respond differently depending on the product's differentiation, the alternatives available, the perceived switching cost, the buyer's budget context, and the trust created by the offer.
A pricing study can produce several useful outputs:
- An acceptable price range, where prices are perceived as neither too cheap nor too expensive.
- Intersection points such as the point of marginal cheapness, point of marginal expensiveness, optimal price point, and indifference price point.
- Stated purchase intent at specific candidate prices.
- A demand estimate or modeled revenue index derived from stated responses.
- Segment-level differences in price perception or intent.
These outputs are not the same as observed revenue. A survey answer indicates what a respondent says about a hypothetical purchase. A modeled revenue index helps compare candidate prices under the assumptions of the method. Neither is a record of completed transactions. Small price changes can also produce limited response until a threshold is crossed, so a smooth-looking average can hide an important decision boundary. The research on consumers often ignore small price moves until a threshold is crossed is relevant when reviewing candidate prices.
Method: Match the Research Method to the Pricing Question
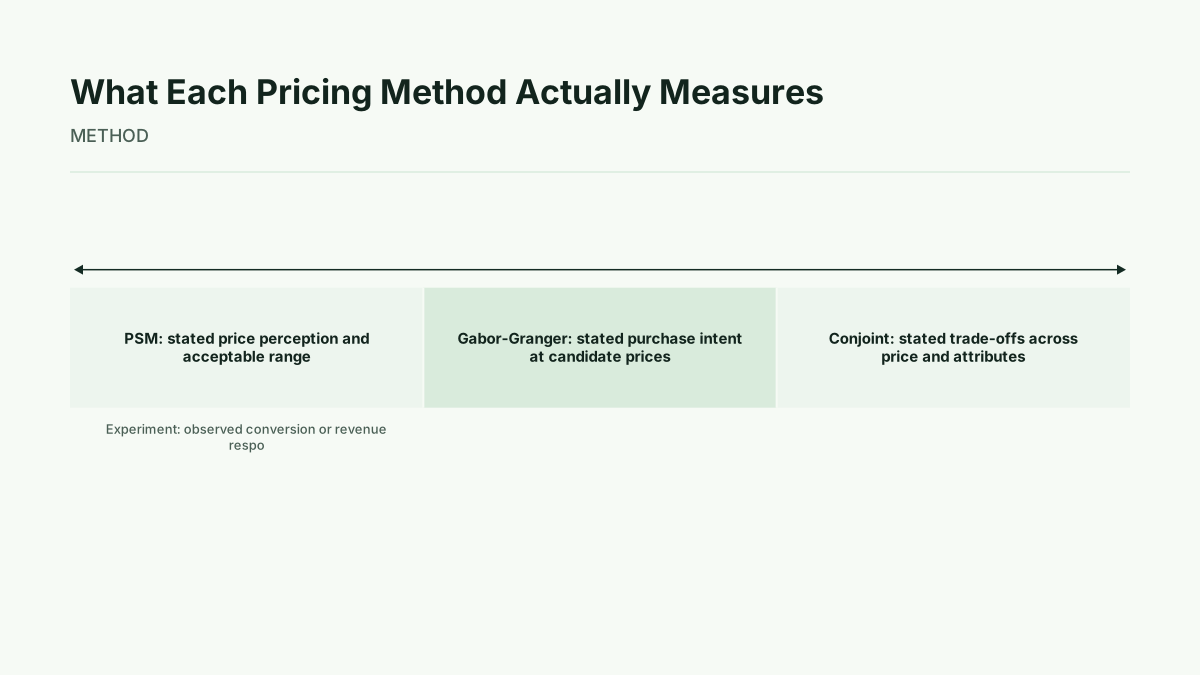
Van Westendorp Price Sensitivity Meter is the starting point when the team does not yet know the plausible range. It uses four open-ended price questions to estimate an acceptable range and intersection points including PMC, PME, OPP, and IPP. Its evidence is stated price perception.
Gabor-Granger is more suitable when the team has a price grid or shortlist. Gabor‑Granger presents candidate prices, measures stated purchase intent, and aggregates acceptance at each price to construct an acceptance curve and modeled revenue index. Its evidence is stated intent at specified prices. The Gabor‑Granger for SaaS price points approach is therefore useful after range-finding has narrowed the options.
Conjoint is appropriate when price must be evaluated alongside features, packages, contract terms, or competitive alternatives. A respondent makes stated choices across combinations, allowing the team to study trade-offs rather than price in isolation. This is the relevant role for willingness to pay research when the commercial decision is really about the offer structure.
Historical elasticity and controlled price experiments answer a different question: how did buyers behave when price or another condition changed? They can measure revealed behavior, but interpretation depends on the quality of the historical comparison or experiment. Promotion, seasonality, traffic mix, product changes, and other concurrent changes can affect the result.
How Van Westendorp Finds an Acceptable Price Range
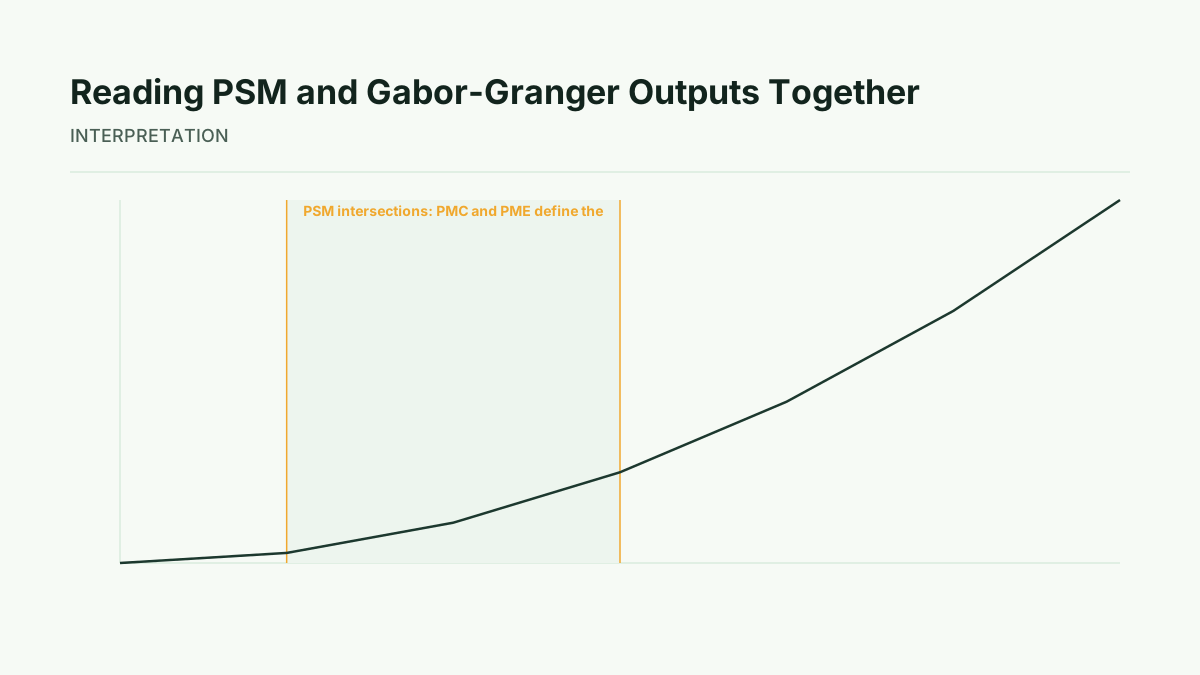
The PSM asks respondents four open-ended questions about when a price is too cheap, cheap, expensive, and too expensive. Responses are converted into cumulative curves. Their intersections provide reference points: PMC and PME are associated with the boundaries of the acceptable range, while OPP and IPP provide additional candidate reference points. The exact interpretation should follow the method's definitions rather than treating any one intersection as an automatic final price.
Response quality matters. Screen for inconsistent answers, inspect unusual response patterns, and keep the sample composition aligned with the target segment. Neutral wording is important because the question itself can anchor the respondent. Industry practitioners consistently recommend checking the quality of PSM responses before interpreting the curves.
PSM describes price perception and boundaries. It does not, by itself, establish purchase probability. A Newton/Miller/Smith extension adds purchase-probability questions to support demand-curve and revenue estimation, but those outputs remain stated or modeled evidence. The method interpolates probabilities across the full price range only within the assumptions of that analysis. Treat the PSM range as a way to bound candidate prices, not as a forecast of realized revenue.
How Gabor-Granger Tests Candidate Price Points
Begin with a candidate price grid that reflects the decision under consideration. Present prices in a controlled or randomized sequence where the research design permits, then ask purchase-intent questions consistently at each price. Aggregate the share of respondents meeting the selected intent criterion at every price to form an acceptance curve.
A modeled revenue index can then compare candidate prices by combining each price with its stated acceptance level. It is a comparison tool, not observed revenue. For example, an Illustrative example, Simulated analysis might compare a lower price with higher stated acceptance against a higher price with lower stated acceptance. The result would show how the modeled index changes across the grid, but it would not establish what visitors will pay or what revenue will occur after launch.
The design still has limits. Showing prices can create anchoring, and hypothetical purchase questions can differ from real purchase behavior. A price-grid result is strongest when the segment, product description, buying context, and intent threshold are clearly defined. Review the acceptance curve for abrupt changes, plateaus, and threshold behavior instead of relying only on its highest modeled point.
When Conjoint or Behavioral Testing Is the Better Choice
Use conjoint when the pricing choice is inseparable from the offer. If a team is deciding between feature tiers, usage limits, contract terms, or competitive alternatives, a price-only question can omit the trade-off that buyers actually face. Conjoint is designed for stated choices across those combinations.
Use historical data or an experiment when the decision requires evidence of what buyers did. Sales data can reveal behavior in past conditions. A controlled price experiment can compare outcomes under defined conditions when the team has sufficient traffic, conversions, controls, and test duration. These requirements are not optional details: without them, a behavioral result may be too noisy or confounded to guide a rollout.
The distinction is practical. PSM can help decide where to look. Gabor-Granger can help compare specified prices using stated intent. Conjoint can help choose among packages. Behavioral evidence can test whether the selected change survives contact with the market.
Interpretation: Turn Curves and Intent Into a Pricing Decision
Use this workflow:
- Define the target segment and the single pricing decision.
- Run PSM if the acceptable range is unknown.
- Select candidate prices inside or around the research-supported range, then run Gabor-Granger if specific prices are available.
- Compare PSM reference points with the Gabor-Granger acceptance curve and modeled revenue index.
- Review results by relevant segment and inspect threshold behavior.
- If features, packages, terms, or competitors are central, use conjoint instead of forcing a price-only conclusion.
- Validate the selected option with observed behavior before a broad price change.
If the methods agree, the evidence is directionally coherent. If they diverge, do not average the outputs into false precision. Investigate whether the difference comes from price perception, candidate-price anchoring, package context, segment composition, or the gap between stated intent and revealed behavior.
Any revenue scenario based on survey acceptance must be labelled Illustrative example and Simulated. It can support downside and upside comparisons, but it must not be described as a forecast or observed outcome.
Limits: Guard Against Bias, Weak Samples, and False Precision
Survey design should address anchoring, neutral wording, sample composition, inconsistent responses, and stated-intent calibration. Convenience samples may not represent the target segment. Survivorship bias can make existing customers look less price-sensitive because people who rejected the offer are absent. Respondent fatigue can reduce the quality of later answers, especially in more complex choice tasks.
Behavioral testing has its own risks. An underpowered experiment may not distinguish noise from a price effect. Confounding factors, promotional noise, traffic changes, product releases, and uneven controls can obscure the result. Historical elasticity can also reflect a mixture of price and context rather than a clean causal response.
Most importantly, do not treat stated purchase intent as a revenue forecast. Survey methods measure what people report under the study conditions. Experiments and sales data measure what happened under particular market conditions. Both can inform a decision, but neither removes the need to define the segment, inspect the design, and monitor the rollout.
Next step: Field, Validate, and Monitor the Price Change
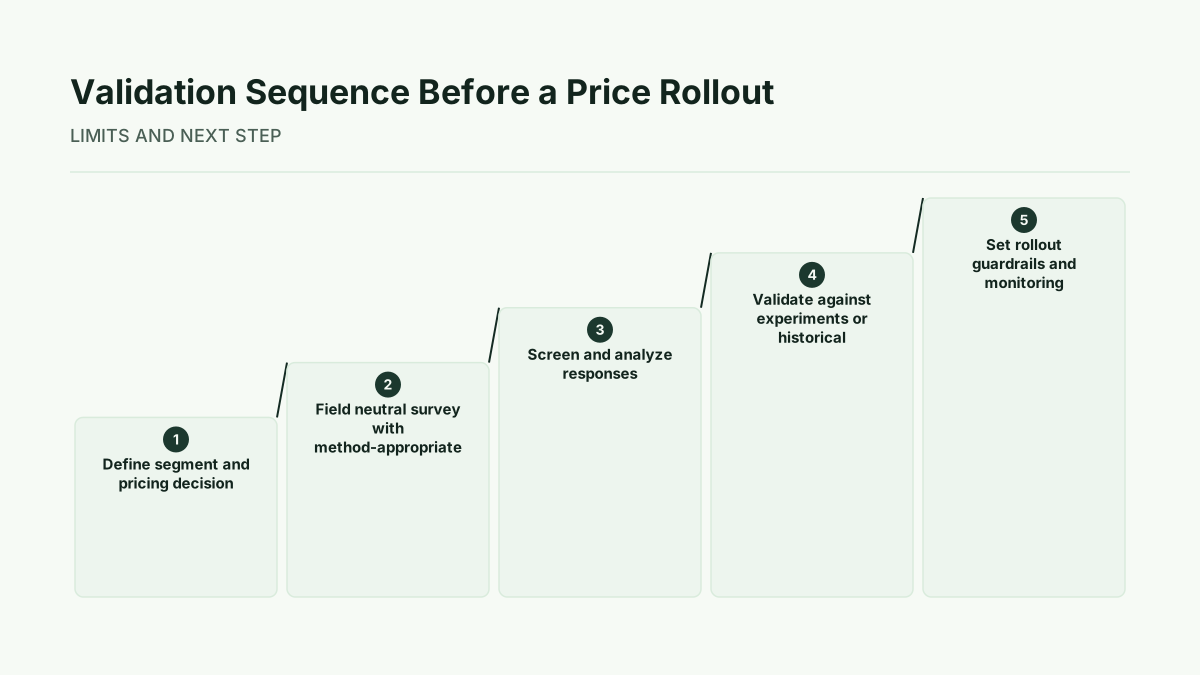
Write the decision in one sentence before writing the survey. Define the target segment, the offer context, the candidate price or package choices, and the behavioral evidence that would change the decision. Set method-appropriate sample requirements, use neutral pricing survey question wording, and predefine response-quality screens.
Field the study, analyze the curves or choice results, and preserve the distinction between perception, stated intent, modeled or simulated revenue, and observed behavior. Then set validation guardrails before rollout. Where conditions allow, compare live outcomes with a suitable control or historical baseline and allow sufficient time for the relevant behavior to appear.
Monitor conversion, churn, average revenue per user, and revenue per visitor as separate indicators. Establish who can pause, revise, or expand the rollout, and record which evidence supports each decision. This turns a one-time pricing test into a governed learning cycle rather than a single number treated as certainty.
For a practical self-serve pricing research guide, Kinetic Pricing provides a structured way to organize the method and decision sequence.
Additional context on these methods is available from pricing analysis, SaaS pricing study, Practitioner guidance, Pro tier, Kineticpricing's pricing research hub, self-serve vs. consultant comparison, Van Westendorp's Price Sensitivity Meter — Wikipedia, Pricing 101: How to Measure Price Sensitivity — Numerator, Consumer Price Sensitivity — BCG, Consumer Price Sensitivity and Price Thresholds — ScienceDirect, Price Sensitivity Research in 2026 — Main Brain Research, Price sensitivity meter (Van Westendorp) — R Market Research (bookdown), Pricing 101: How to Measure Price Sensitivity - Numerator, Consumer price sensitivity | BCG and Consumer price sensitivity and price thresholds (ScienceDirect).
Run this method with your users
Start 30-day free trial to run every method with your users, or Buy one study when one decision needs evidence now.
Sources
Wikipedia, “Van Westendorp's Price Sensitivity Meter.”
MetricGate, “Van Westendorp Price Sensitivity Meter (PSM) Calculator.”
Numerator, “Pricing 101: How to Measure Price Sensitivity.”
Kinetic Pricing, “Test SaaS Price Points with Gabor-Granger.”
Kinetic Pricing, “Willingness to Pay.”
Boston Consulting Group, “Consumer Price Sensitivity.”
ScienceDirect, “Consumer Price Sensitivity and Price Thresholds.”
R Market Research, “Price Sensitivity Meter (Van Westendorp).”
Kinetic Pricing, “Pricing Survey Questions.”