
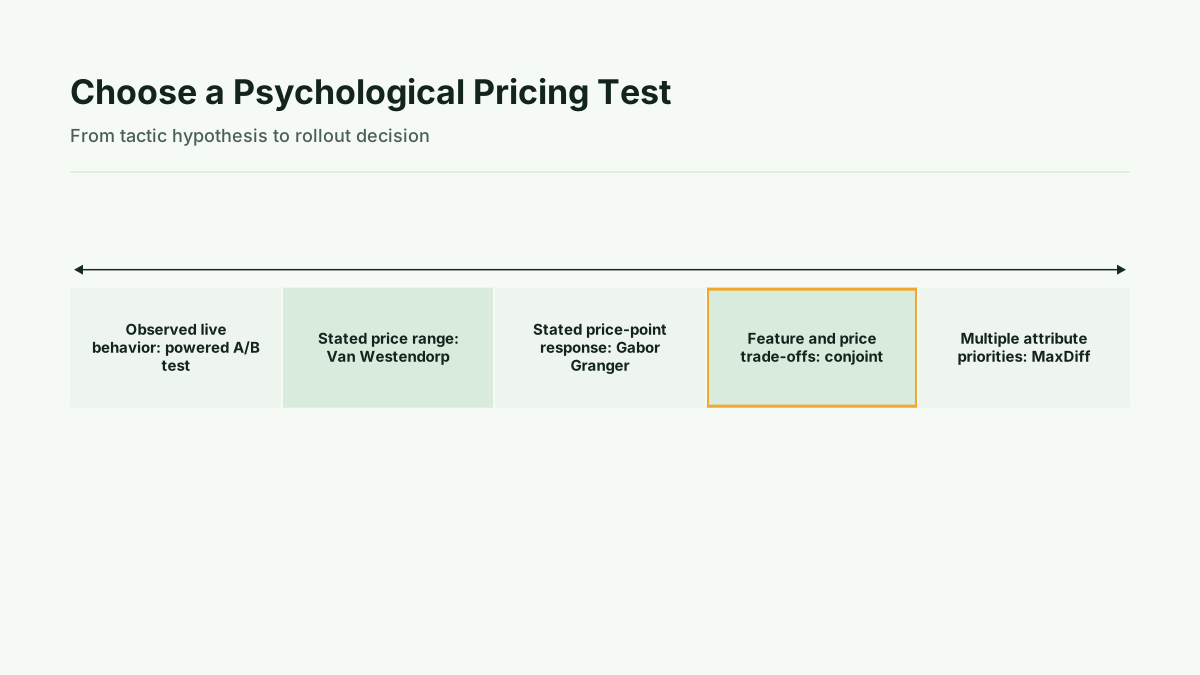
Yes. Test one psychological pricing hypothesis with the customers and buying context where the price is actually evaluated before changing the live offer. Use a powered A/B test when the decision concerns observed purchase behavior. Use Van Westendorp, Gabor Granger, MaxDiff, or conjoint when the question concerns stated preferences, price ranges, or feature and price trade-offs.
Psychological Pricing Is a Hypothesis, Not a Rule
Psychological pricing changes how an offer is presented and perceived. It can include charm pricing, such as a price ending in nine, as well as anchoring, decoys, bundling, price partitioning, prestige pricing, urgency, and scarcity. These tactics do not all answer the same question, and they should not be treated as interchangeable rules.
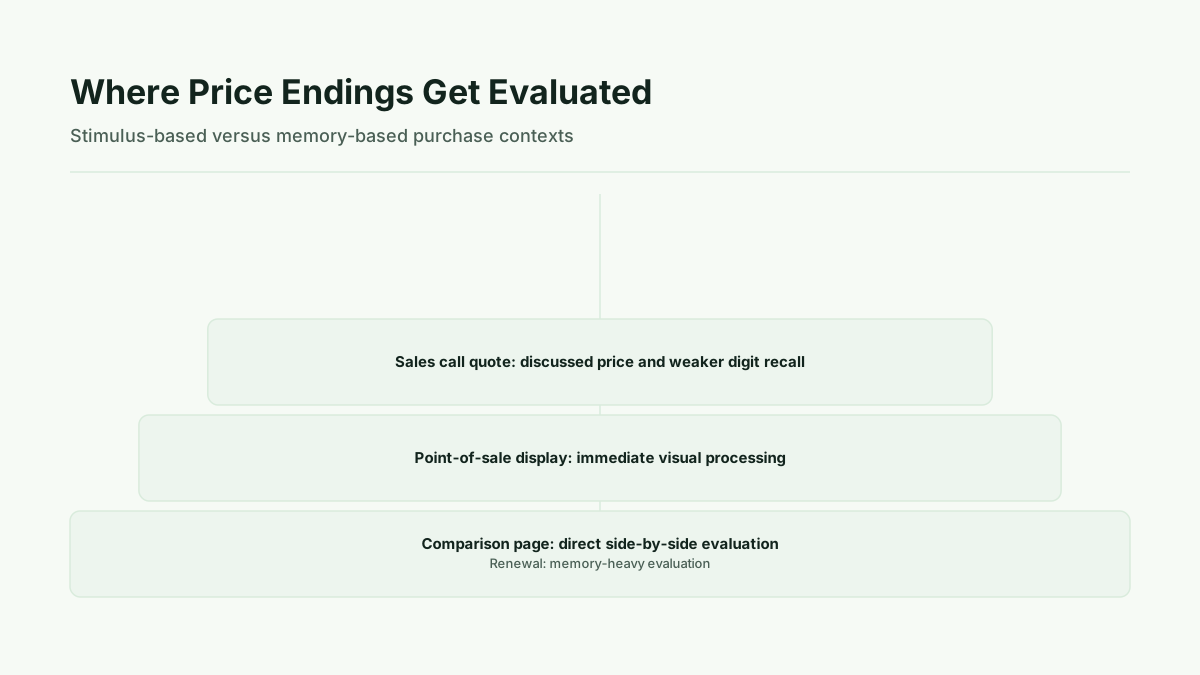
A useful distinction is whether the buyer responds to a visible stimulus or relies on memory. A comparison page and a point-of-sale display put prices in front of the buyer for immediate evaluation. A renewal or a sales-call purchase may involve more discussion, recall, and contextual judgment. Evidence indicates that psychological pricing effects vary by category, price level, brand positioning, and whether shoppers compare prices side by side or from memory. The Journal of Retailing and Consumer Services 2022 review describes this context dependence, while Sokolova et al. (2020) examines when left-digit effects may occur.
That variation is the reason to treat a proposed price ending or framing device as a hypothesis. The hypothesis might be: “Showing the same offer with a charm ending will improve completed purchases in this comparison context without weakening downstream customer outcomes.” It might instead be: “A round price will better support a premium position for this audience.” Neither statement should become a rollout rule without local evidence.
What the Research Says About Charm Pricing
The evidence does not support a universal claim that nine-ending prices increase conversion or revenue. A large preregistered online experiment described by Sokolova et al. (2020) did not find a statistically significant left-digit or perceptual-fluency effect across thousands of purchasing decisions. That result is important because it distinguishes observed purchase behavior in a large experiment from the broad marketing folklore surrounding charm pricing.
At the same time, the 2022 review reports that nine-ending prices can affect purchasing attitudes and brand revenue. Its conclusion is context-dependent rather than absolute. Sample size, category, price level, brand positioning, and the way a shopper encounters the price can all affect confidence in applying a finding to a new business.
This is not a contradiction. A result can be plausible in a visually comparative setting and less dependable when customers evaluate a remembered price, a negotiated quote, or a recurring renewal. The relevant question is not whether charm pricing “works” in general. It is whether a specific presentation changes behavior or preference in a specific buying situation.
Match the Tactic to the Buying Context
Start with the moment at which a customer evaluates the price. Comparison pages and point-of-sale displays are stimulus-based environments where the displayed digits are directly available for inspection. Recall-heavy situations, including renewals and some sales-call purchases, provide a weaker basis for assuming that a price ending will carry the same weight. The context distinction described by Sokolova et al. (2020) should shape both the test design and the level of confidence in a result.
Brand positioning matters as well. Round prices can communicate prestige in premium contexts, while charm endings can signal discount positioning in some categories. The appropriate choice may therefore depend on whether the offer is meant to convey premium positioning or a discount-oriented signal. The source on prestige pricing supports this distinction, but it does not establish a universal rule for every premium B2B, luxury, hospitality, or professional-service offer.
Other tactics need the same discipline. An anchor should be truthful and relevant. Scarcity and urgency should describe real conditions rather than fabricated limits. Partitioned prices should make required charges visible rather than hiding fees until late in the buying process. False reference prices, fabricated scarcity, and hidden fees can create consumer-trust and consumer-protection risks, as discussed in the practitioner summary on inflation-era pricing.
Method: Design the Test Before Changing the Price
Method. First, identify one presentation hypothesis. Keep the underlying decision narrow: a price ending, a truthful reference price, or one framing change. Then define the primary metric before launch. If the goal is observed behavior, the primary metric may be completed purchase conversion, with revenue per visitor or average order value as an important economic measure. If the goal is preference or perception, state that the output will be stated rather than observed.
Next, choose the method that matches the question:
- A/B testing measures observed live conversion behavior between defined offer presentations.
- Van Westendorp estimates a stated acceptable price range through price-perception questions.
- Gabor Granger tests stated purchase likelihood at specified price points.
- MaxDiff ranks the relative importance of features or attributes.
- Conjoint estimates stated trade-offs among packages, features, and prices.
The distinction among these methods is described in Kinetic Pricing resources on Van Westendorp, price sensitivity analysis, and well-structured survey questions. A survey cannot become an observed conversion test merely because respondents say they intend to buy. Conversely, an A/B result cannot explain every feature and contract-length trade-off without a design that measures those attributes.
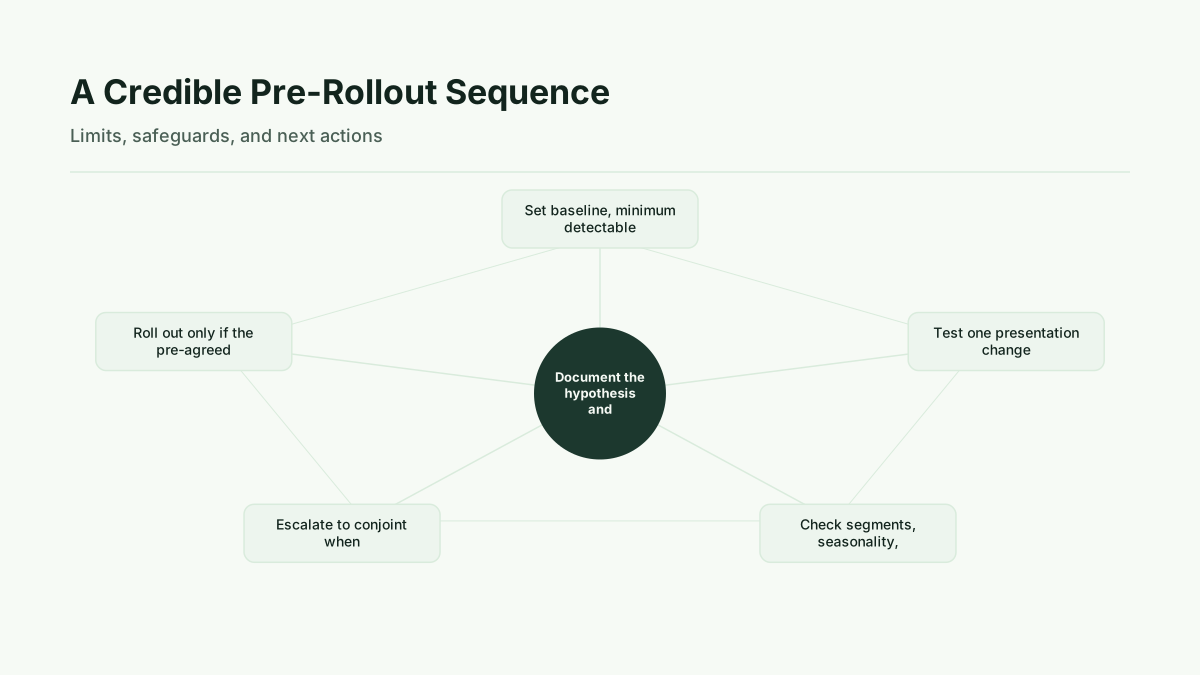
Before launch, document the baseline, minimum detectable effect, sample plan, run time, segment checks, data-quality checks, and decision rule. Sample requirements should be calculated before the test begins, using the baseline and the effect that would matter to the decision. A sample-size calculation resource provides a framework for this planning. Run the test across a complete purchase cycle where possible, rather than stopping when an early movement appears persuasive.
Interpretation: Separate Conversion, Revenue, and Preference
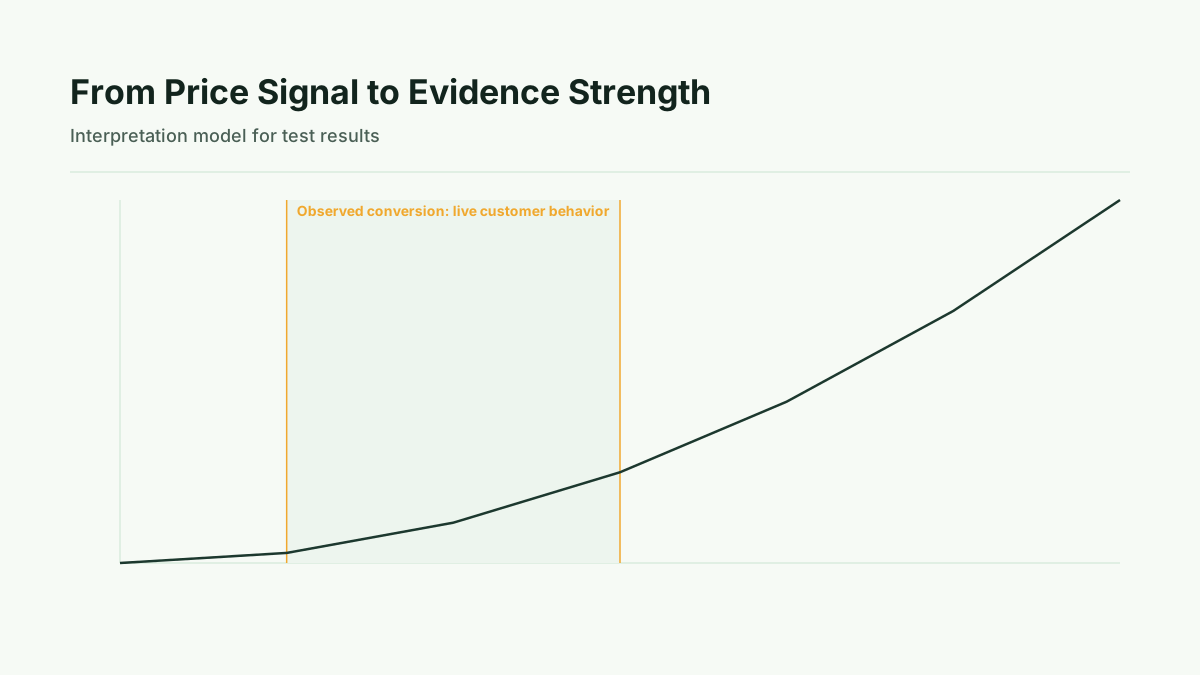
Interpretation. Keep three evidence types separate. Stated purchase intent is what respondents report in a research exercise. Observed behavior is what customers do in the live test. Modeled or simulated revenue is a projection based on assumptions or estimated preferences. It is not observed revenue until actual customer transactions validate it.
Read the primary metric first, then examine the economic and customer guardrails. Conversion rate may show whether more visitors complete the target action. Revenue per visitor and average order value help determine whether a conversion change is economically meaningful. Complaints, returns, retention, and churn can reveal costs that a short conversion window misses.
Use confidence intervals and the pre-agreed rollout threshold rather than treating any movement as proof. Check whether the direction is consistent across the segments that matter, while avoiding a post hoc search for a favorable subgroup. If a survey suggests that a price ending is preferred, describe that as stated preference. If a model projects revenue, label it modeled or simulated. If a live experiment records purchases, label that observed behavior.
Limits: Why a Positive Result May Not Generalize
Limits. A positive result can be fragile. An underpowered test may fail to distinguish noise from a meaningful effect. A convenience sample may not represent the customers who make the purchase. Channel effects can change how a price is noticed, and seasonal bias can change who arrives or what they need. Category differences can make a finding from one market inappropriate for another.
Memory-based purchasing creates another limit. A customer may not inspect the final digits closely when renewing, recalling a quoted price, or comparing an offer through a conversation. Multiple tactics can also interact. Changing an ending, an anchor, and a bundle at the same time makes it harder to attribute an outcome to one hypothesis.
Survey quality matters in stated-preference work. Poorly designed questions, inattentive respondents, and other data-quality issues can weaken interpretation. Live tests also require checks for bot traffic and incomplete purchase paths. Finally, a short-term conversion lift is not automatically a durable pricing win. Retention and churn may require a longer observation period than the initial purchase decision.
Next step: Run the Smallest Credible Validation
Next step. Choose the offer where customers visibly compare prices most directly. Write one hypothesis, select one price-ending or framing change, and preserve a truthful presentation of the offer. Define the baseline, minimum detectable effect, sample plan, run time, guardrails, and rollout threshold before exposure begins.
Then test the single change in the strongest relevant context. Review observed conversion and economic measures, followed by complaints, returns, retention, churn, segment consistency, seasonality, and bot checks. If the result does not meet the pre-agreed rule, do not convert an ambiguous signal into a permanent pricing convention.
Escalate to conjoint when the price is entangled with features, tiers, packages, or contract length. Use Van Westendorp when the central question is an acceptable price range, Gabor Granger when it is response to specified price points, and MaxDiff when the decision requires relative attribute priorities. The smallest credible validation is the one that answers the actual decision without confusing stated preference, modeled revenue, and observed behavior.
Additional context on these methods is available from 5%, self-serve research versus consultant comparison, free pricing benchmarks, Psychological pricing: Myth or reality? The impact of nine-ending prices on purchasing attitudes and brand revenue (Journal of Retailing and Consumer Services 2022), The left-digit bias: When and why are consumers penny wise and pound foolish? (Sokolova et al., 2020) and Psychological Pricing Tactics to Fight the Inflation Blues (Harvard Business School Working Knowledge, 2024).
Run this method with your users
Start 30-day free trial to run every method with your users, or Buy one study when one decision needs evidence now.
Sources
ScienceDirect, “Psychological pricing: Myth or reality? The impact of nine-ending prices on purchasing attitudes and brand revenue.”
SAGE Journals, “The left-digit bias: When and why are consumers penny wise and pound foolish?”
Harvard Business School Working Knowledge, “Psychological Pricing Tactics to Fight the Inflation Blues.”
Kennesaw State University DigitalCommons, “Prestige Pricing.”
Kinetic Pricing, “Van Westendorp Pricing Research for SaaS.”
Kinetic Pricing, “Price Sensitivity Analysis.”
Kinetic Pricing, “Pricing Survey Questions.”
AB Tasty, “Sample Size Calculation.”