
Use Van Westendorp first for exploratory range discovery, Gabor-Granger for price-point and modeled-revenue analysis, and both in sequence when you need a defensible range followed by a tested price ladder. The right choice depends on whether your decision is about what customers may consider acceptable or which tested price performs best on stated purchase intent.
Start with the decision your research must support
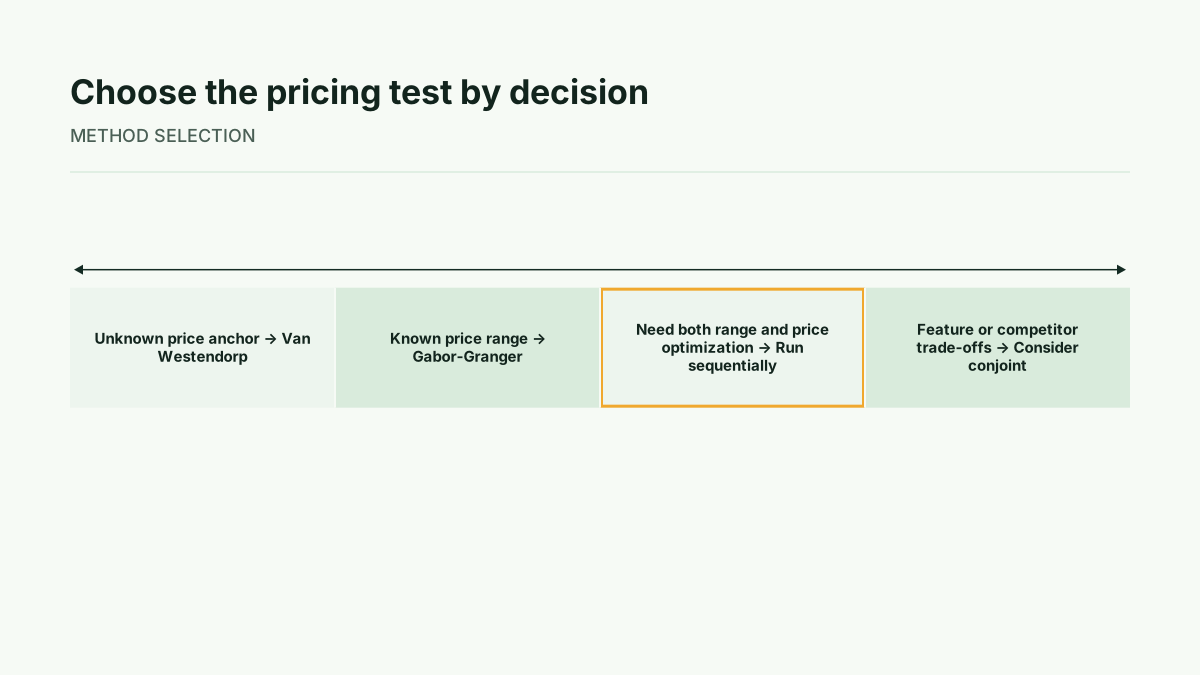
Begin by writing one decision in plain language. For example: “What price range should we investigate?” calls for a perception-oriented method. “Which prices should we test within an established range?” calls for a price-ladder method. “How should price, features, packages, and competitors trade off?” points beyond either direct survey method.
Van Westendorp is best suited to exploratory pricing work where the acceptable range and perceived quality floor are uncertain. This is particularly useful when no competitive anchor exists, because the research can surface how respondents perceive prices as too cheap, cheap, expensive, or too expensive. Van Westendorp is especially useful when no competitive anchor exists.
Gabor-Granger is a better fit when you already have a plausible range and need to compare defined price points. It uses purchase-intent responses across a researcher-defined ladder to estimate demand and modeled revenue across the tested prices. Both methods answer different questions, so choosing between them is a decision about the output you need, not simply a preference between survey formats.
What Van Westendorp reveals about price perception
The Van Westendorp Price Sensitivity Meter asks four perception questions. Respondents identify the price that feels too cheap, cheap or a bargain, expensive, and too expensive for the product concept. The responses are plotted as cumulative curves. Their intersections help describe the range in which prices may be perceived as acceptable.
The lower and upper boundaries are commonly described as the point of marginal cheapness, or PMC, and the point of marginal expensiveness, or PME. The interval between PMC and PME is the acceptable price range. Other intersections, including the indifference price point, or IDP, and the optimal price point, or OPP, help describe how the perception curves relate to one another.
The “too cheap” curve also matters because a low price can create a quality-perception concern. That does not make the lowest acceptable price the correct commercial price. It gives the team a way to discuss the floor implied by respondents’ perceptions before selecting prices for more focused testing.
Treat these outputs as a map of price perception rather than a purchase forecast. A range can be broad, narrow, stable, or difficult to interpret depending on the product concept, respondent fit, and response quality. The method is most useful when the team needs to discover a plausible range before committing to a price ladder.
What Gabor-Granger reveals about demand and revenue
Gabor-Granger presents respondents with a product concept and a researcher-defined sequence of prices. At each price, the survey records stated purchase intent. Those responses are aggregated into a demand curve across the tested ladder. The price points can then be combined with the stated demand estimates to create a modeled revenue curve.
The revenue peak is the tested price with the highest modeled revenue under the study’s assumptions. It is not observed transaction behavior, and it is not a guarantee that the same price will maximize realized revenue after launch. Gabor-Granger converts a purchase-intent ladder into both a demand curve and a revenue curve.
The ladder must be designed around the decision. If the existing range is uncertain, the selected prices may be too narrow, too wide, or poorly centered. A practical design may test 5–7 price points, but that is study guidance rather than a universal rule. The important question is whether the ladder gives the team enough coverage to compare plausible alternatives without implying precision the research cannot support.
A Gabor-Granger result is therefore strongest when the team has a clear product concept, a qualified audience, and a price range worth testing. It answers a narrower question than Van Westendorp, but it can provide a more direct comparison of stated demand and modeled revenue across specified prices.
Compare the methods before choosing one
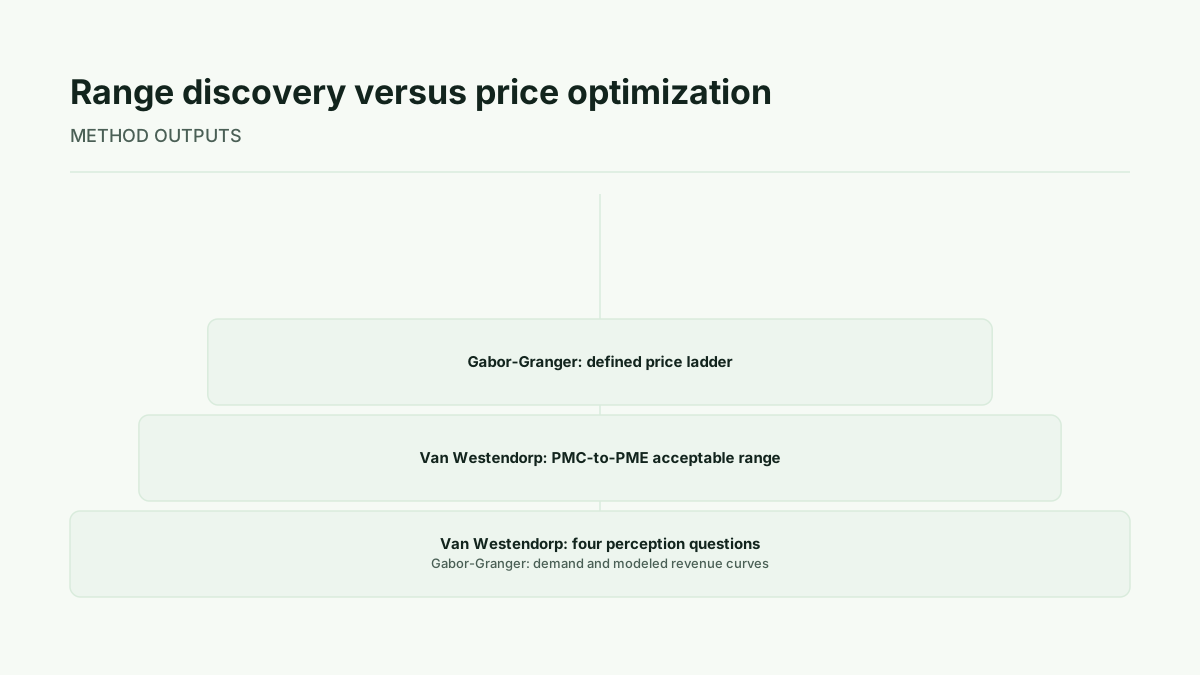
Van Westendorp takes price perceptions as its primary input. Its outputs are the four perception curves, the PMC-to-PME acceptable range, and related intersections such as IDP and OPP. It fits an early-stage decision in which the team is uncertain about the price anchor or perceived quality floor.
Gabor-Granger takes a defined price ladder and purchase-intent responses as its primary inputs. Its outputs are a demand curve and a modeled revenue curve across the tested prices. It fits a decision in which the team has a plausible range and wants to compare price points within it.
The methods also have different failure modes. Van Westendorp can produce unstable or difficult-to-read intersections when responses are noisy or the concept is unclear. Gabor-Granger can be sensitive to the selected ladder and to how prices anchor respondents. Neither method, by itself, tells you how customers trade price against features, packages, or competitors. Neither accounts for competitive substitution or feature trade-offs.
That distinction is central for SaaS teams. If the decision concerns a single product concept and price, a direct pricing method may be appropriate. If the decision concerns package design, feature inclusion, or competitive alternatives, conjoint analysis is the more relevant escalation because it addresses those trade-offs.
When running both methods is the better design
Many teams run both in sequence. First, use Van Westendorp to establish a plausible perceptual range. Then use that range to define the Gabor-Granger price grid. Many teams run both in sequence. This design separates two decisions that are often confused: discovering where prices may feel acceptable and comparing performance across selected prices.
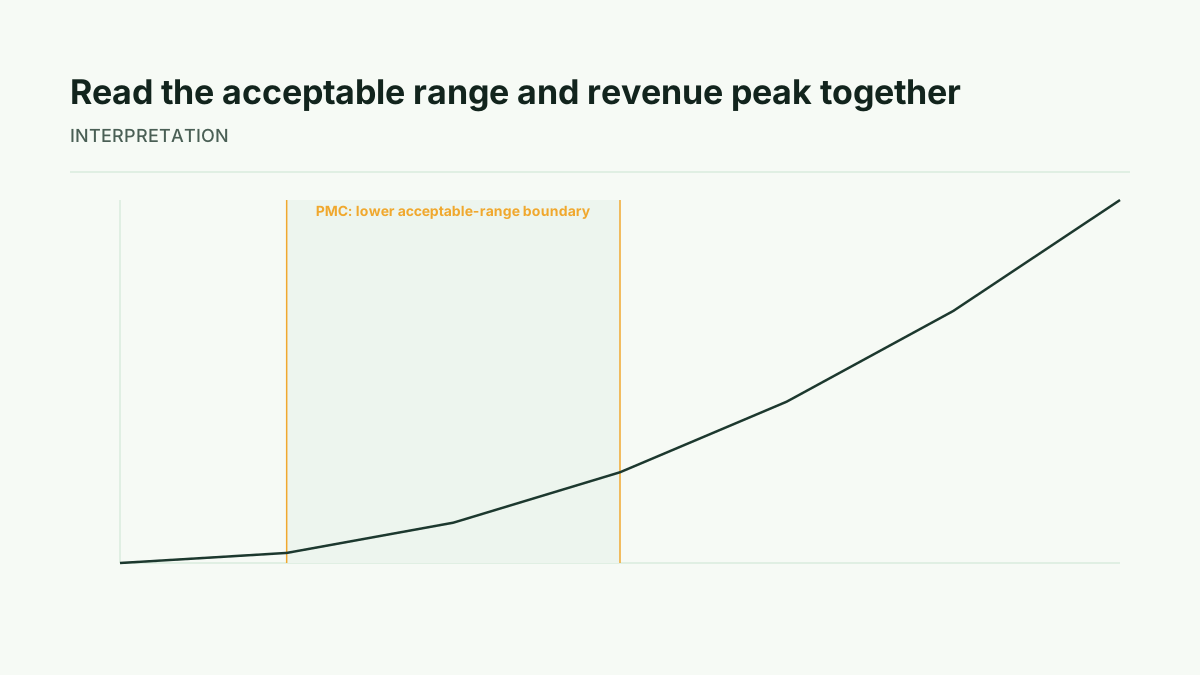
The sequence also creates a useful conflict check. If the modeled revenue peak falls within the acceptable range, the two outputs support a coherent next hypothesis. If the peak sits outside the range, investigate the result rather than automatically accepting it. The difference may reflect the tested ladder, perception responses, or the fact that the methods answer different questions.
Check response patterns before interpreting either result. An all-yes pattern across the Gabor-Granger ladder suggests the tested prices may not reach a meaningful resistance point. An all-no pattern suggests the ladder or product concept may be too expensive for the qualified audience. These patterns do not prove a final price, but they indicate that the study design needs review.
Method: design the study around one pricing decision
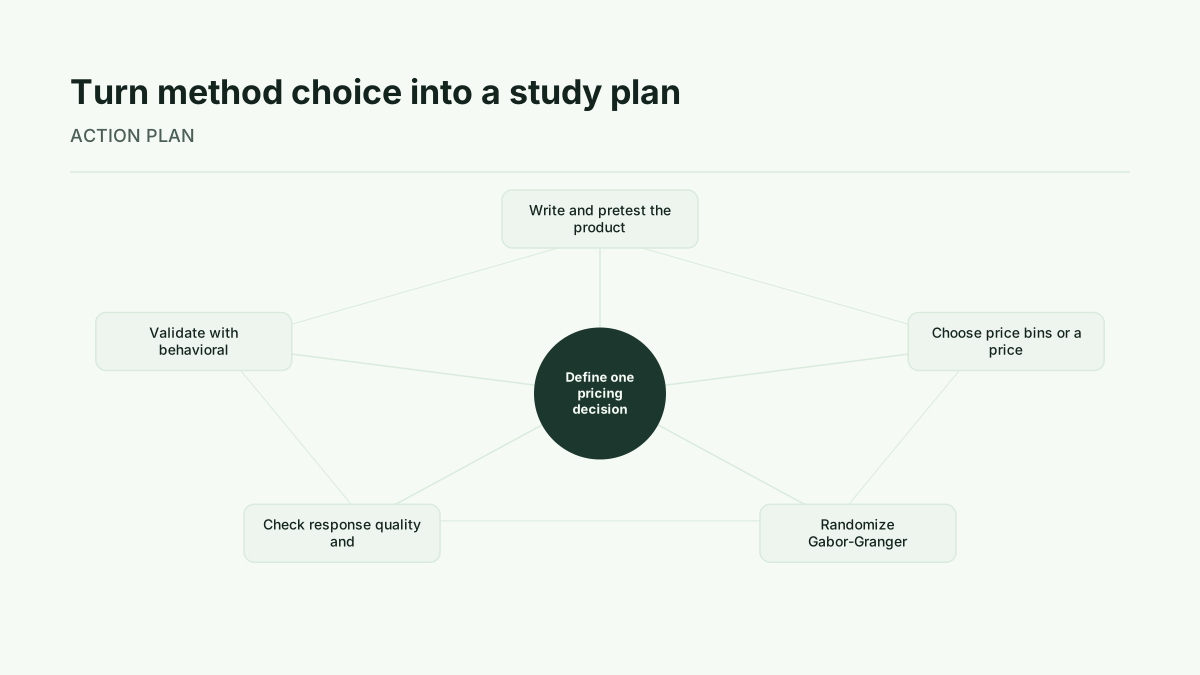
Start with a concise product concept that gives every respondent the same reference point. Define who qualifies and why that audience is relevant to the purchase decision. For Van Westendorp, prepare the four price-perception questions. For Gabor-Granger, define a price ladder that covers the range the team genuinely needs to compare. pricing survey question design should make the wording, units, billing period, and product scope unambiguous.
For a Gabor-Granger study, consider randomizing starting prices or ladder exposure where the design permits, so the first price does not become the only anchor. Review incomplete responses, inconsistent answers, and other data-quality signals before fitting curves. Then inspect the shape of the curves, the location of intersections, the stated-intent pattern, and the modeled revenue peak together.
For a sequential study, do not treat the Van Westendorp range as a finished price recommendation. Use it to inform the later grid, then analyze the Gabor-Granger results as a separate layer of evidence. The design should preserve the distinction between perceived acceptability and stated demand.
Interpretation: treat survey outputs as directional evidence
A Van Westendorp answer describes stated price perception. A Gabor-Granger answer describes stated purchase intent at researcher-defined prices. A modeled revenue curve is calculated from those stated responses and the tested prices. None of these is the same as observed transaction behavior, such as completed purchases, upgrades, retention, or realized revenue.
Both methods measure stated preferences rather than observed transaction behavior, so their outputs should be treated as directional pricing evidence. This extension links perceived acceptability to stated purchase probability, but it does not turn stated intent into a guaranteed outcome.
Use the results to decide what to test next, which assumptions need validation, and whether the pricing question is narrow enough for a direct method. Do not present an acceptable range or modeled revenue peak as a promise about launch performance.
Limits: know when neither direct method is enough
Both methods rely on a stated response to a product concept. That creates a gap between what respondents say and what they later do. Anchoring can affect responses, price ladders can omit important alternatives, and small or poorly matched samples can create noisy curves. These are design risks to investigate, not universal guarantees about any particular study.
Neither method captures competitive substitution or feature trade-offs as conjoint analysis does. If customers choose between packages, weigh features against price, or compare your offer with named alternatives, a direct price test may omit the decision structure that matters most. Behavioral validation is also needed when the team must understand observed willingness to pay rather than stated preference.
Unstable intersections, all-yes or all-no patterns, and a revenue peak outside the perceptual range are reasons to pause and diagnose the study. They are not automatic evidence that one method is correct and the other is wrong.
Next step: select the smallest credible study
Use Van Westendorp when the acceptable range or price anchor is unknown. Use Gabor-Granger when the range is established and the decision is which tested price performs best on stated demand and modeled revenue. Run both sequentially when you need range discovery followed by price-point optimization. Escalate to conjoint when package, feature, or competitor trade-offs drive the decision.
The smallest credible study is the one that answers one clearly defined pricing question with a suitable audience, transparent price framing, quality checks, and an interpretation plan. Explore Kinetic Pricing plans.
Additional context on these methods is available from Van Westendorp suits exploratory work; Gabor-Granger suits projects with an existing price baseline, 5–7 price points, pricing survey question design, free pricing research templates, Survey pricing methodologies: Gabor-Granger vs. Van ..., Smart Pricing Research: Van Westendorp, Gabor-Granger & Conjoint | Lab42 — Lab42 Research Insights and Van Westendorp vs. Gabor-Granger: Price Sensitivity Methods.
Run this method with your users
Start 30-day free trial to run every method with your users, or Buy one study when one decision needs evidence now.
Sources
MarketBridge, Survey pricing methodologies: Gabor-Granger vs. Van Westendorp
Koji, Gabor-Granger Pricing Method: Find Your Optimal Price
Lab42, Smart Pricing Research: Van Westendorp, Gabor-Granger & Conjoint
Drive Research, Gabor Granger vs van Westendorp Models: Which To Use
Quirk's, A look at three survey-based methods for pricing research