
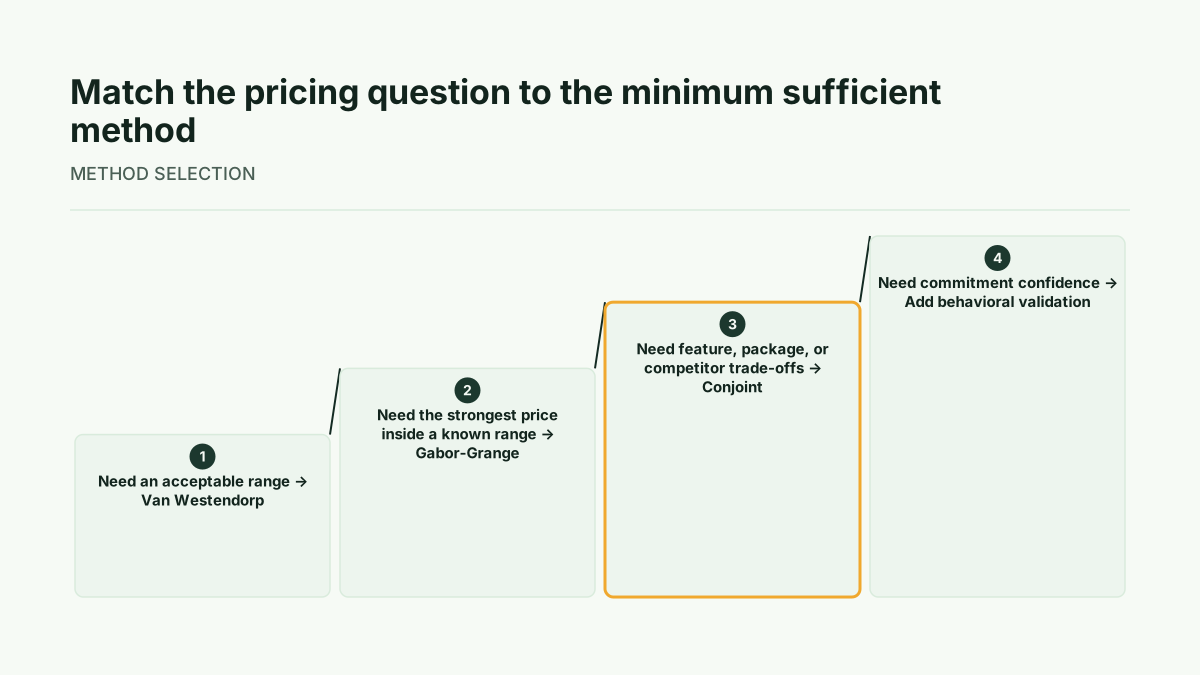
The right sequence is usually simple: use Van Westendorp to establish an acceptable price range, Gabor-Granger to test price points within that range, and conjoint when feature bundles or competitive alternatives materially affect willingness to pay. Treat the resulting outputs as stated or modeled evidence, then validate a high-stakes decision with behavioral evidence.
This is a guide to survey-based willingness-to-pay research. It is not a commercial price waterfall diagnostic, which answers a different question.
Start with the pricing decision, not the survey method
Begin by writing the decision in operational terms. Are you trying to identify an acceptable range, select a price that compares well on modeled revenue, or choose among packages whose features and competitive alternatives change perceived value?
The answer determines the minimum sufficient study. A range decision does not require the same design as a package decision. Before fielding, define the KPI, the population or segment under consideration, and the decision rule that will be applied to the results. The decision rule should state what evidence would support a price, what would require more research, and what would trigger behavioral validation.
This prevents the survey method from becoming the decision. A method is useful only when its output answers the commercial question. If the question is about psychological price bounds, choose a range method. If it is about defined price points, choose a price-point test. If attributes and alternatives materially shape the choice, use a multi-attribute method.
What Van Westendorp, Gabor-Granger, and conjoint each reveal
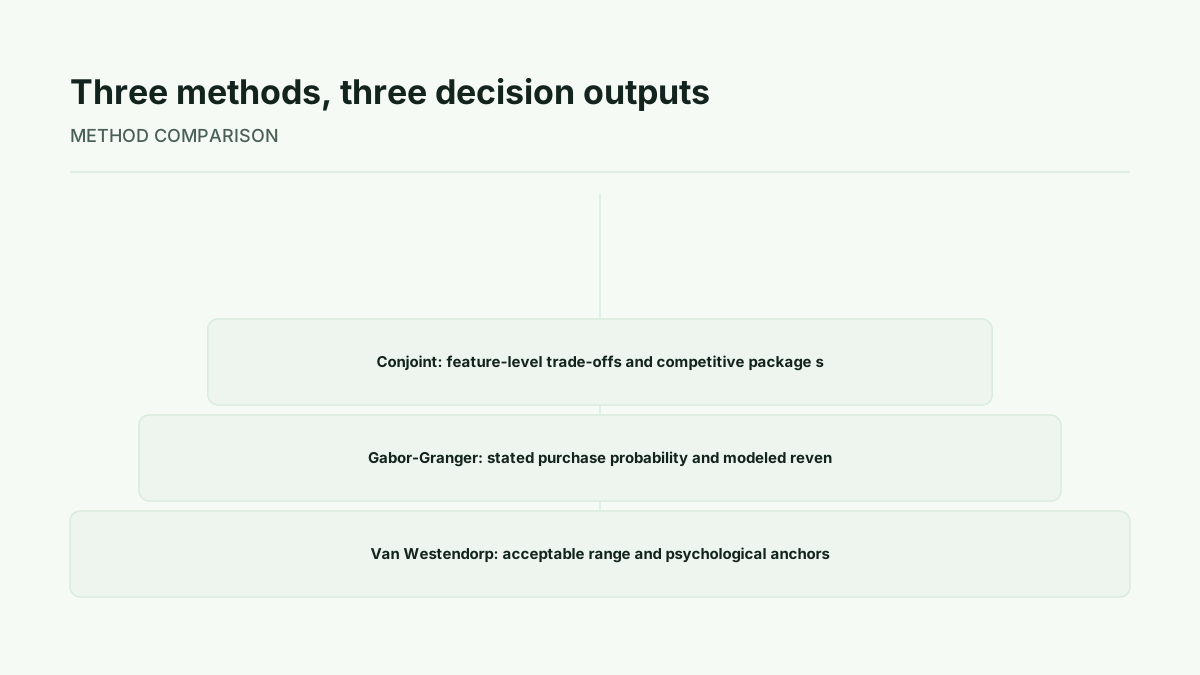
Van Westendorp is suited to establishing an acceptable price range and psychological price anchors. It can help identify where prices may be perceived as too low, acceptable, expensive, or too high. It does not produce a revenue estimate on its own. [SUPRA, “Pricing Research Methods: From Conjoint to Behavioral Testing”]
Gabor-Granger tests stated purchase intent at defined price points. Those responses can be used to construct a modeled demand and revenue curve, allowing the team to compare price-point scenarios. The output is a stated probability at tested prices, not an observed purchase record. [Lab42, “Smart Pricing Research: Van Westendorp, Gabor-Granger & Conjoint”]
Conjoint is appropriate when feature trade-offs, package design, or competitive alternatives materially affect the pricing decision. Its role is to estimate how respondents trade attributes and price in the designed choice context. It becomes the escalation path when a simple price question would omit the elements that customers compare. [SUPRA, “Pricing Research Methods: From Conjoint to Behavioral Testing”]
The practical sequence is to establish a plausible range before testing specific price points, then add conjoint only when multi-attribute or competitive context changes the decision. This is the core distinction in Van Westendorp and Gabor-Granger together: first bound the question when needed, then test the prices that matter. [Lab42, “Smart Pricing Research: Van Westendorp, Gabor-Granger & Conjoint”]
Build the study in a deliberate sequence
Method: Use a staged process. First define the objective, KPI, segment, and pre-fielding decision rule. Next set the sample plan, screening criteria, and quotas appropriate to the decision. Then write realistic product concepts and price questions. Open-ended price-perception work can establish a plausible range before defined price-point testing. Add quality controls, analyze the appropriate outputs, and report segment differences and uncertainty.
The deliverable should match the method. Van Westendorp produces a price-range view and psychological anchors. Gabor-Granger produces purchase-intent observations at researcher-defined prices and supports modeled demand and revenue comparisons. Conjoint produces utility and trade-off outputs for package, feature, or competitive simulations.
Survey design quality materially affects predictive validity. [SUPRA, “Pricing Research Methods: From Conjoint to Behavioral Testing”] That makes realistic concepts, appropriate screening, response-quality controls, and a disciplined reporting plan part of the research design rather than administrative detail. The report should state the recommendation, its assumptions, segment differences, and the validation step required before launch.
Convert stated preferences into revenue scenarios
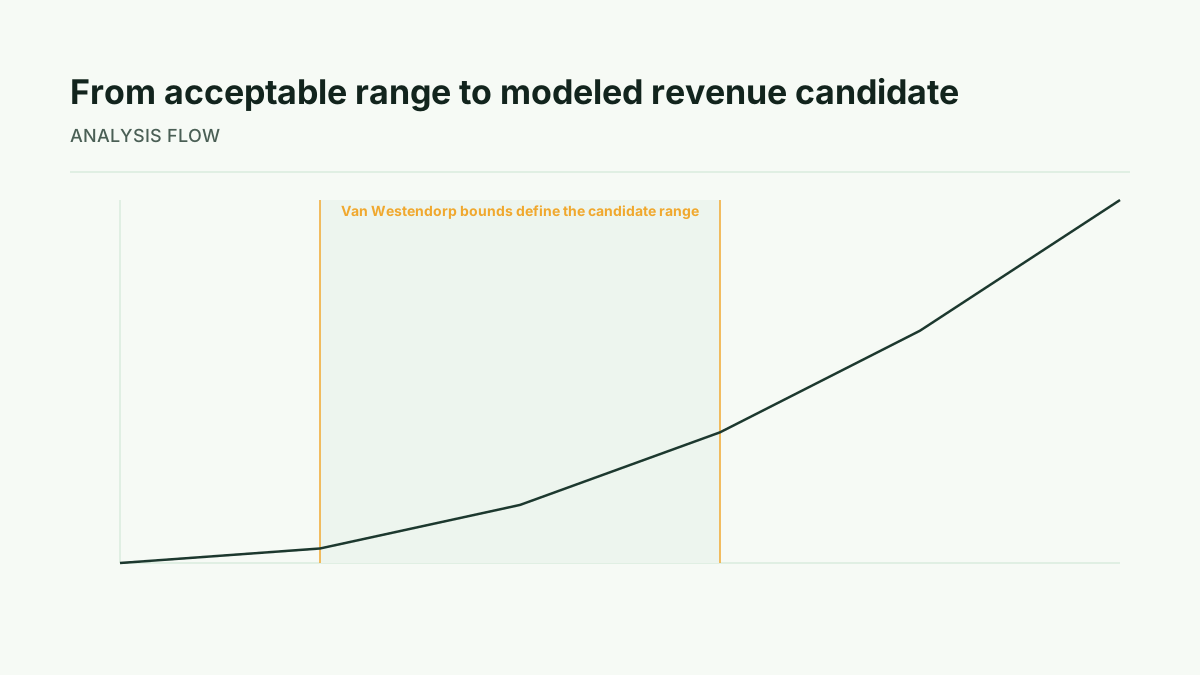
A basic modeled revenue comparison combines price, stated purchase probability, and addressable-market size. In compact form:
Modeled revenue = price per customer × modeled purchase probability × addressable-market units.
The acceptable range can constrain the candidate prices tested in Gabor-Granger. The resulting purchase probabilities can then be compared across those price points. The highest modeled revenue point is a candidate for a decision, not a guaranteed outcome.
Use best, likely, and worst scenarios rather than a single forecast. The scenarios should make the addressable-market assumption visible and show how the recommendation changes if that assumption changes. Revenue scenarios should distinguish modeled revenue from observed behavior and show sensitivity to addressable-market assumptions. [SUPRA, “Pricing Research Methods: From Conjoint to Behavioral Testing”]
Do not label a modeled result as sales, conversion, or realized revenue. A survey response is stated purchase intent. A revenue curve is modeled output. Observed behavior requires a behavioral signal such as a pilot, an A/B test, or a small-market rollout.
Interpret the output without overstating certainty
Interpretation: Read Van Westendorp as directional psychological price bounds. Read Gabor-Granger as stated purchase probability at defined price points that supports modeled revenue comparisons. Read conjoint as evidence about feature and price trade-offs in a competitive or multi-attribute context.
These outputs help rank decisions. They do not guarantee market outcomes. A defensible recommendation should identify the preferred price, the assumptions behind it, its sensitivity to market size and conversion, and the validation step required before launch.
Curves and simulators are most useful when they make trade-offs explicit. For example, a higher price may be paired with lower modeled purchase probability, while a lower price may be paired with a different modeled revenue result. The research does not remove the decision. It clarifies which assumptions drive it and which comparisons deserve validation.
Know when survey-based WTP is the wrong waterfall
Survey-based WTP research answers a demand-side price-perception question. A commercial price waterfall diagnostic uses transaction data to investigate discount and margin leakage. [SUPRA, “Pricing Research Methods: From Conjoint to Behavioral Testing”]
Those scopes should not be merged. If the issue is why net realized price differs from list price because of discounts, rebates, allowances, or other deal-level effects, a survey-based WTP study is not the diagnostic described here. If the issue is how prospective customers perceive price, range, packages, or alternatives, demand-side research may be appropriate.
Validate before making a high-stakes price change
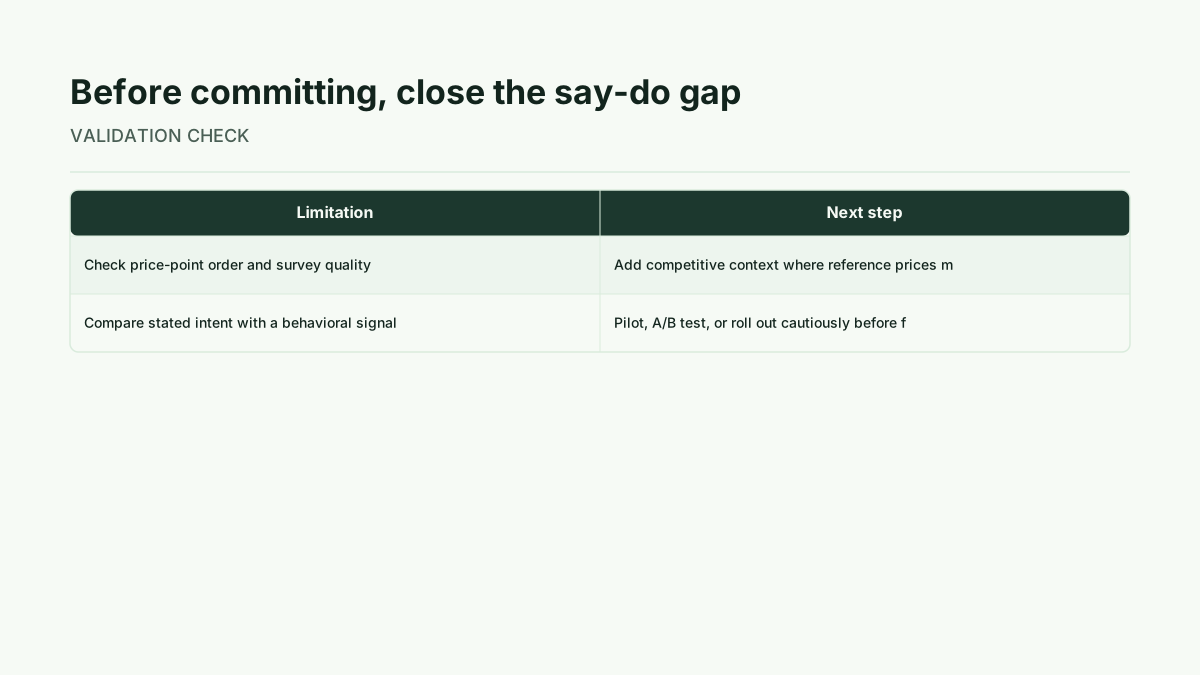
Limits: Stated-preference research can diverge from behavior. Price-point order can anchor responses. Unrealistic concepts or prices reduce usefulness. Missing competitive context can distort reference prices. Long surveys can increase noise. Revenue scenarios depend on addressable-market assumptions. Survey-based WTP research does not diagnose deal-level discount leakage or net realized price.
Use these limits as a validation checklist. Check price-point order and response quality. Add competitive context when reference prices matter. Compare stated intent with a behavioral signal. Then pilot, A/B test, or roll out cautiously before making a full commitment. The appropriate validation design depends on the risk and the decision context, but the principle is consistent: treat survey outputs as directional evidence until behavior provides a stronger check.
Next step: apply the minimum sufficient research design
Next step: Choose Van Westendorp when the decision is an acceptable range, Gabor-Granger when the range is known and the decision is among defined price points, and conjoint when features, packages, or competitors materially affect willingness to pay. Add behavioral validation when the commitment is high or the cost of being wrong is material.
Teams that need to run the selected study can See Kinetic Pricing study options.
Kinetic Pricing’s available method products include Price range finder, Price point tester, Feature value ranker, and Package and price builder. Pro is priced at 9900 cents monthly or 99000 cents annually and includes a 30-day trial. [Kinetic Pricing pricing information]
Additional context on these methods is available from Van Westendorp vs Gabor-Granger, proven pricing survey questions, Apply a conservative uplift of 10–20%, downloadable revenue scenario workbooks, free trial on the Pro plan, Kineticpricing, Pricing Research Methods: From Conjoint to Behavioral Testing | SUPRA, Smart Pricing Research: Van Westendorp, Gabor-Granger & Conjoint | Lab42 — Lab42 Research Insights, Van Westendorp Pricing Research for SaaS | Kinetic Pricing, Kinetic Pro: Unlimited Pricing Studies | Kinetic Pricing, Pricing Analysis: From Data to a Pricing Decision | Kinetic Pricing and Willingness to Pay: Definition and How to Measure It | Kinetic Pricing.
Run this method with your users
Start 30-day free trial to run every method with your users, or Buy one study when one decision needs evidence now.
Sources
SUPRA, Pricing Research Methods: From Conjoint to Behavioral Testing
Lab42, Smart Pricing Research: Van Westendorp, Gabor-Granger & Conjoint
Kinetic Pricing, Pricing
Kinetic Pricing, Pro